
Antibody Specificity: A Practical Validation Guide for Researchers
Antibody specificity is the relative propensity of an antibody to bind its intended epitope over structurally related off-targets — a property that is never absolute, always assay-dependent, and directly determines whether your experimental data reflects biology or artifact. Before running a single experiment, three criteria should anchor your evaluation: (1) confirm expression-level orthogonality using knockout or knockdown controls, (2) obtain a quantitative affinity metric such as KD or EC50 measured by SPR or BLI, and (3) verify signal absence in matched negative controls. Skipping any one of these steps is how a plausible-looking western blot band becomes a retraction.
- Orthogonal expression controls: Knockout or knockdown cell lines are the gold standard for confirming that signal disappears when the target is absent. Knockdown via siRNA is acceptable when a KO line is unavailable, but document the residual expression level.
- Quantitative affinity metric: A KD from ELISA titration gives a relative EC50; SPR or BLI gives true kinetic KD, kon, and koff. Both are useful; only the latter distinguishes high-affinity specific binding from avidity-driven apparent affinity.
- Negative controls: Isotype-matched controls, secondary-only controls, and blocking peptides each address a different source of background. Run all three, not just one, and document the result for every antibody lot.
Mayflowerbio recommends maintaining a written audit trail for each lot, recording which assays were run, under what conditions, and what the outcome was. That record is what makes your data reproducible — and what saves you six months of troubleshooting when a new lot behaves differently.
Table of Contents
- What is antibody specificity at the molecular level?
- How do cross-reactivity and polyspecificity differ?
- How do you measure antibody specificity in the lab?
- Which epitope-mapping technique should you use?
- What does a rigorous antibody validation workflow look like?
- What quantitative metrics should you report?
- Common specificity failures and how to fix them
- Key Takeaways
- Why specificity validation is the most undervalued step in experimental design
- Mayflowerbio supports your antibody validation workflow
- Useful sources and further reading
What is antibody specificity at the molecular level?
Specificity originates in the geometry and chemistry of the antigen-binding site. Six hypervariable loops, three from the heavy chain variable domain (VH) and three from the light chain variable domain (VL), fold together to form the complementarity-determining regions (CDRs). These CDRs present a surface that is complementary in shape and electrostatic character to a discrete patch on the antigen called the epitope. The paratope, the antibody’s functional binding surface, is composed of roughly 15 amino acid residues drawn from those CDR loops, though only about 5 of those residues contribute the majority of binding energy. A single amino acid substitution in either partner can reduce equilibrium binding constants by several orders of magnitude.
Non-covalent forces drive the interaction: hydrogen bonds, van der Waals contacts, electrostatic interactions, and hydrophobic packing all contribute. No single force type dominates universally; the balance shifts with epitope chemistry. Hydrophobic patches in the CDRs that are too extensive tend to produce polyreactivity — low-affinity, non-specific sticking to unrelated surfaces — which is why hydrophobicity profiling of variable regions is now a standard early-stage developability check.

Affinity vs. avidity: why the distinction matters experimentally
Affinity describes the binding strength of a single paratope to a single epitope, expressed as the equilibrium dissociation constant KD (units of molarity; lower = tighter). KD is derived from the association rate constant kon (M⁻¹s⁻¹) and the dissociation rate constant koff (s⁻¹): KD = koff / kon. Two antibodies with identical KD values can have very different kinetics — one with fast kon and fast koff, another with slow kon and slow koff — and those kinetic profiles translate directly into different behaviors in cell-based assays and in vivo.
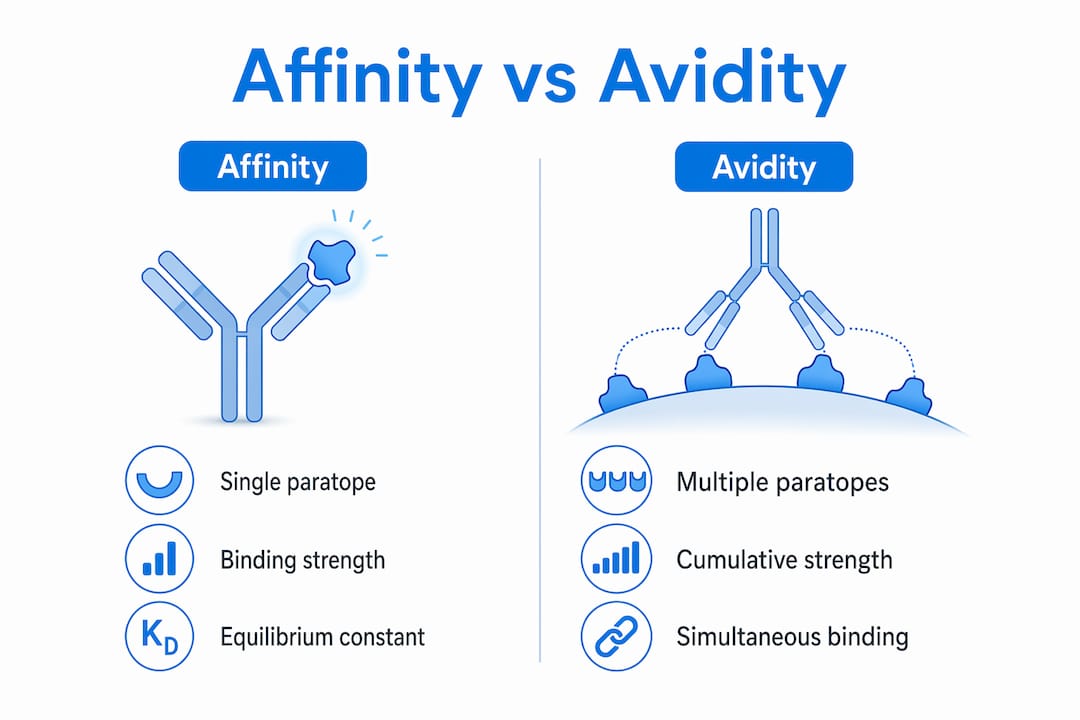
Avidity is the cumulative binding strength when multiple paratopes engage multiple epitopes simultaneously, as occurs with bivalent IgG on a densely expressed cell-surface target or in a plate-based ELISA. Avidity can make a low-affinity antibody appear highly specific in a plate assay while masking genuine off-target interactions that only surface in a monovalent or solution-phase format. This is not a trivial distinction: low-affinity off-target interactions that are invisible in ELISA can be amplified in vivo by high receptor density. Running both a monovalent SPR measurement and a cell-based assay is the only way to catch both.
How affinity maturation shapes specificity
During a germline B cell response, somatic hypermutation introduces point mutations throughout the variable regions, and clones with improved KD for the immunizing antigen are positively selected in germinal centers. This process, affinity maturation, sculpts the energy landscape of binding: the specific interaction deepens while off-target interactions are relatively disfavored. The result is not a binary switch from non-specific to specific, but a continuous shift in the distribution of binding free energies. Antibodies exist on a spectrum, and where any given clone sits on that spectrum depends on the immunization protocol, the adjuvant, the antigen format, and the selection pressure applied during screening.
“Interactions exist on a continuum of binding free energy and residence time rather than as an absolute binary. Recognizing this continuum is what separates a researcher who troubleshoots effectively from one who discards a useful antibody prematurely.” — Energy landscape framework for immunology, Frontiers in Immunology, 2025
How do cross-reactivity and polyspecificity differ?
These terms are frequently conflated, and the confusion costs researchers time. Here are precise definitions with experimental anchors:
- Monospecificity: The antibody binds a single epitope on a single antigen with no detectable signal against a panel of structurally related proteins. Confirm with a recombinant protein panel in ELISA or SPR.
- Cross-reactivity: The antibody binds the intended antigen and at least one related antigen (e.g., a homologous protein from another species, or a paralog). Cross-reactivity is quantified as percent cross-reactivity relative to the primary antigen signal. It can be intentional and useful — a cross-reactive anti-human antibody that also binds mouse ortholog enables in vivo pharmacology studies.
- Polyspecificity: Discrete off-target binding interactions with measurable affinity, often to structurally unrelated antigens. Unlike cross-reactivity, polyspecificity is not driven by sequence homology but by coincidental shape or charge complementarity. It carries real risk for therapeutic candidates because it can alter pharmacokinetics and trigger safety signals.
- Polyreactivity: Low-affinity, broadly promiscuous binding driven by excess hydrophobicity or localized positive charge in the variable regions. Polyreactive antibodies stick to DNA, lipids, heparin, and insulin simultaneously at low affinity. The same physicochemical features that cause polyreactivity also drive aggregation and poor pharmacokinetics in therapeutic development.
- Heterospecificity: A single antibody binding site that accommodates structurally distinct epitopes — not through low-affinity promiscuity, but through conformational flexibility of the CDR loops. Rare, but documented in natural antibodies.
Context dependence is the key practical point. An antibody that looks monospecific in a denaturing western blot (where the antigen is unfolded) can show polyspecificity in a native cell-surface assay where conformational epitopes are exposed. Conversely, an antibody flagged as polyreactive in a bead-based polyreactivity screen may perform cleanly in a well-optimized IHC protocol with appropriate blocking. Treat cross-reactivity data as assay-specific, not as a universal property of the clone.
Natural IgM antibodies are intentionally polyreactive at low affinity — this broad recognition is a feature of innate-like immune surveillance, not a flaw. The same behavior in a recombinant monoclonal antibody intended for a specific target is a development liability.
How do you measure antibody specificity in the lab?
Choosing the right assay depends on what you need to know: qualitative presence/absence, relative EC50, or true kinetic KD. The table below maps each method to its primary readout, sample type, key strengths, and the caveats that most often trip up researchers.
| Assay | Sample type | Primary readout | Key strengths | Key caveats |
|---|---|---|---|---|
| ELISA | Purified protein, cell lysate, serum | Relative EC50 (semi-quantitative) | High throughput, inexpensive, familiar | Avidity inflation; coating can denature epitopes; misses low-affinity off-targets |
| Western blot | Denatured cell/tissue lysate | Qualitative band presence/absence | Checks denatured epitope; MW confirmation | Denaturing conditions; cannot assess native conformation; common source of false positives |
| IHC | FFPE or frozen tissue sections | Qualitative/semi-quantitative staining pattern | Spatial context; clinically relevant format | Fixation alters epitopes; high background without optimized blocking; requires KO tissue control |
| Flow cytometry | Live or fixed cells | Quantitative MFI; % positive cells | Native cell-surface epitopes; single-cell resolution | Fc receptor binding; requires titration; cell prep affects surface antigen integrity |
| SPR | Purified protein | Kinetic KD, kon, koff | True monovalent kinetics; gold standard for affinity | Requires purified antigen; immobilization can block epitope; mass transport artifacts |
| BLI | Purified protein | Kinetic KD, kon, koff | Label-free; no microfluidics; faster throughput than SPR | Lower sensitivity than SPR for very tight binders; tip-to-tip variability |
| Multiplex arrays | Serum, lysate, conditioned media | Relative signal across many analytes simultaneously | High-content orthogonal screen; flags off-targets early | Requires validated capture antibodies for each analyte; cross-reactivity between analytes possible |
| Peptide arrays | Purified antibody | Linear epitope mapping; relative binding across peptide library | Rapid linear epitope scan; no specialized instrument | Misses conformational epitopes entirely |
| Competition/blocking assay | Purified protein or cells | % inhibition of primary antibody signal | Confirms epitope overlap; validates blocking peptide | Requires well-characterized competitor or peptide; indirect readout |
Biochemical assays (ELISA, western blot) are the right starting point for most labs because they are fast and inexpensive. Their limitation is that classical biochemical assays can miss low-affinity off-target interactions that are amplified in cell-surface contexts through avidity. Cell-based assays (IHC, flow cytometry) add physiological relevance but introduce new variables: fixation chemistry, receptor density, and Fc receptor expression. Biophysical methods (SPR, BLI) are the only approaches that give true monovalent kinetics, and they should be used whenever a quantitative KD is needed for publication or preclinical decision-making.
Pro Tip: Run SPR or BLI in a single-cycle kinetics format when antigen supply is limited. You get kon, koff, and KD from a single chip surface with as little as 50–100 µg of purified antigen.
For high-throughput early screening, multiplex assays allow simultaneous measurement of binding across dozens of analytes in a single well, making them particularly effective for flagging polyspecific clones before investing in full characterization.
Which epitope-mapping technique should you use?
Epitope mapping tells you exactly where on the antigen surface your antibody binds. That information resolves ambiguous cross-reactivity, guides engineering decisions, and is increasingly expected in high-impact publications. The right technique depends on whether the epitope is linear or conformational, and how much resolution you need.
Peptide arrays and alanine scanning for linear epitopes
Peptide arrays present overlapping 15–20-mer peptides spanning the full antigen sequence on a membrane or chip. The antibody is incubated across the array, and binding signal identifies the minimal linear sequence recognized. Alanine scanning takes the next step: each residue within the identified peptide is substituted with alanine, and the drop in binding signal identifies the contact residues that contribute most to binding energy. Together, these two approaches can define a linear epitope to single-residue resolution in a matter of days.
The hard limit is conformational epitopes. If your antibody recognizes a three-dimensional surface formed by residues that are far apart in primary sequence, peptide scanning and alanine scanning will produce weak or no signal regardless of how well the antibody binds the native protein. Treating a negative peptide array result as proof of a conformational epitope is reasonable, but it is not proof of the epitope’s location.
HDX-MS and mass spectrometry-based mapping
Hydrogen-deuterium exchange mass spectrometry (HDX-MS) measures the rate at which backbone amide hydrogens exchange with deuterium from the solvent. Regions of the antigen that are protected by antibody binding exchange more slowly, and that protection pattern is detected by mass spectrometry at peptide-level resolution. HDX-MS works on native, folded proteins and is therefore the method of choice for conformational epitopes that peptide arrays cannot resolve. It also handles large, glycosylated, or membrane-associated antigens that are difficult to crystallize.
When cross-reactivity between two related antigens is ambiguous, HDX-MS on both antigen-antibody complexes can reveal whether the antibody contacts the same or different surface patches, directly explaining the cross-reactive behavior. Epitope mapping by mass spectrometry more broadly, including chemical cross-linking MS (XL-MS), extends this to larger complexes and can provide distance constraints useful for computational docking.
When to escalate to structural methods
X-ray crystallography and cryo-EM provide atomic-resolution epitope maps and are the definitive answer to any mapping question. They are also expensive, slow, and require substantial protein engineering effort. The decision to escalate should follow a clear logic:
- If peptide arrays and alanine scanning give a clean linear epitope and the cross-reactivity profile is fully explained, stop there.
- If HDX-MS resolves the conformational epitope and explains cross-reactivity, that is usually sufficient for publication and most preclinical decisions.
- Escalate to crystallography or cryo-EM when: the antibody is a clinical candidate, the mechanism of action depends on precise epitope knowledge (e.g., blocking a protein-protein interaction), or two antibodies with similar KD values show unexpectedly different functional profiles that HDX-MS cannot distinguish.
Cryo-EM has largely displaced crystallography for large antigen-antibody complexes because it does not require crystal formation and tolerates heterogeneous samples. For small haptens or peptide epitopes, crystallography remains faster and more informative.
What does a rigorous antibody validation workflow look like?
Validation is not a single experiment. It is a structured sequence of checkpoints, each designed to catch a different failure mode before you commit to a full experimental program. The workflow below is lab-ready and maps directly to the controls expected by high-impact journals and regulatory agencies.
-
Review the vendor datasheet. Confirm the immunogen sequence, species reactivity, tested applications, and lot number. Check whether the datasheet includes a KO control image. If it does not, plan to generate one. Mayflowerbio’s antibody product pages include application-specific validation data to support this step.
-
Titrate the antibody in your intended application. Determine the optimal working concentration empirically. A concentration that is too high inflates background; too low misses real signal. Titration is not optional — it is the first experiment.
-
Run a positive control. Use a cell line or tissue known to express the target at high levels. Confirm signal is present and at the expected molecular weight, subcellular location, or staining pattern.
-
Run a knockout or knockdown control. This is the single most informative specificity control. Signal in a KO/KD sample is, by definition, non-specific. For cellular disease models, this step is part of the broader model validation framework and should be documented alongside the antibody characterization record.
-
Run isotype and secondary-only controls. Isotype controls address Fc receptor-mediated background (critical in flow cytometry and IHC). Secondary-only controls confirm that the secondary antibody is not contributing signal independently.
-
Test a blocking peptide. Incubate the antibody with a molar excess of the immunogen peptide before applying it to your sample. Signal should be substantially reduced or eliminated. This confirms that the observed signal is driven by the intended epitope.
-
Perform orthogonal verification. Confirm the result in at least one additional assay format. A band on western blot confirmed by IHC staining in the expected tissue compartment is far more credible than either result alone.
-
Screen an expression panel. Test the antibody against a panel of cell lines or tissues with varying target expression levels. Signal should correlate with known expression. Unexpected signal in a low-expression or target-negative sample is a red flag for cross-reactivity.
-
Document everything in an audit trail. Record the lot number, assay conditions, instrument settings, positive and negative control results, and any anomalies. This record is what enables reproducibility across experiments, labs, and time.
Decision points: After steps 3–5, if signal is clean in positive controls and absent in KO/KD, the antibody is provisionally validated for that application. If signal persists in KO/KD samples, do not proceed. Either optimize blocking conditions, switch antibody clones, or escalate to epitope mapping to understand the off-target. After step 8, if the expression panel correlation is poor, suspect cross-reactivity and run a recombinant protein panel by ELISA or SPR before continuing.
Pro Tip: Animal-derived antibodies do not automatically carry assay-appropriate specificity. Add in vitro deselection checkpoints regardless of whether the antibody was raised in rabbit, mouse, or another host. The immunization process selects for immunogenicity, not for the assay conditions you will use.
What quantitative metrics should you report?
Reproducibility in antibody-based research depends on reporting enough detail that another lab can evaluate whether your antibody would behave the same way in their hands. The metrics below are the minimum set.
| Metric | Definition | Recommended reporting fields |
|---|---|---|
| KD | Equilibrium dissociation constant (M); lower = higher affinity | Assay format (SPR/BLI/ELISA), antigen form, buffer, temperature, antibody format (IgG/Fab), valency |
| kon | Association rate constant (M⁻¹s⁻¹) | Same as KD; report with standard error |
| koff | Dissociation rate constant (s⁻¹) | Same as KD; report with standard error |
| EC50 | Half-maximal effective concentration from a sigmoidal dose-response curve | Assay type, cell line or antigen, assay buffer, plate format, detection method |
| IC50 | Half-maximal inhibitory concentration | Assay type, target, competitor or substrate, assay conditions |
| % cross-reactivity | (Signal for off-target / signal for primary target) × 100 at equimolar concentration | Antigen panel tested, assay format, antibody concentration |
| LOD | Lowest analyte concentration producing signal distinguishable from background (mean blank + 3 SD) | Assay format, sample matrix, detection method |
Practical thresholds are context-dependent. A KD of 1 nM is excellent for most research applications; a therapeutic candidate targeting a low-copy-number receptor may require sub-nanomolar affinity to achieve adequate receptor occupancy. Percent cross-reactivity below 1% is generally acceptable for monospecificity claims in research settings, but the threshold tightens considerably for clinical diagnostics or therapeutic development.
For accurate and reproducible assay data, always report the analyte concentration range over which the curve was fit, not just the EC50 point estimate. A curve fit from 3 points is not the same as one fit from 10 points across 4 logs of concentration.
Example Methods snippet (copy-adaptable):
Binding kinetics were measured by SPR (Biacore T200, Cytiva) at 25°C in HBS-EP+ buffer. Antigen was captured on a CM5 chip via amine coupling to ~200 RU. Antibody was injected in single-cycle format at five concentrations (1.56–25 nM). Data were fit to a 1:1 Langmuir model. KD = 4.2 nM (kon = 1.8 × 10⁵ M⁻¹s⁻¹; koff = 7.6 × 10⁻⁴ s⁻¹). Percent cross-reactivity against the closest paralog was 0.8% at equimolar concentration by ELISA.
Common specificity failures and how to fix them
Most specificity problems fall into a small number of recognizable patterns. Knowing which pattern you are looking at cuts troubleshooting time significantly.
-
Multiple bands on western blot: The most common complaint. First, titrate the antibody down — high concentrations produce non-specific bands in virtually every western blot system. If extra bands persist at low concentration, check whether they disappear in the KO/KD sample. Bands present in KO are non-specific; bands absent in KO may represent isoforms, post-translational modifications, or proteolytic fragments of the target. Adjust SDS-PAGE conditions (reducing vs. non-reducing) and sample preparation (lysis buffer, protease inhibitors) before concluding the antibody is unsuitable.
-
Non-specific staining in IHC: Usually a blocking problem. Increase blocking serum concentration, extend blocking time, or switch to a polymer-based detection system that eliminates endogenous biotin interference. For IHC amplification strategies, tyramide signal amplification can improve sensitivity while allowing lower primary antibody concentrations, which reduces background. Always include a KO or knockdown tissue section as the definitive negative control.
-
Signal in KO/KD samples: This is the most serious failure mode and means the observed signal is not from the intended target. Check whether the KO is complete (confirm by PCR and a second antibody). If the KO is confirmed, the antibody has a genuine off-target. Run an epitope-mapping experiment to identify the off-target, or switch to a different clone.
-
High background in ELISA: Usually caused by antibody concentration that is too high, insufficient washing, or non-specific adsorption to the plate. Titrate the antibody, increase wash stringency (add 0.05% Tween-20), and consider switching from direct coating to a capture format. If background persists, test the antibody in a solution-phase competition format to confirm it is not the plate surface driving the signal.
-
Unexpected signal in flow cytometry: Fc receptor expression on monocytes, macrophages, NK cells, and dendritic cells causes non-specific antibody binding in any cell mixture. Block Fc receptors with human IgG or a dedicated Fc block reagent before adding the primary antibody. For cell separation and panel design, selecting cell populations with low Fc receptor expression for initial validation reduces this variable.
-
Suspecting polyreactivity: If an antibody shows signal across multiple unrelated targets in a panel screen, run a bead-based polyreactivity assay (DNA, insulin, heparin, LPS). Confirm with antigen-density titrations: polyreactive signal typically increases disproportionately at high antigen density due to avidity. If polyreactivity is confirmed, the antibody is unsuitable for most applications without engineering to remove the hydrophobic or charged CDR patches responsible.
For early-stage screening programs, drug screening pipelines that incorporate multi-assay biophysical panels can flag polyreactive clones before they consume significant downstream resources.
Key Takeaways
Antibody specificity is a relative, assay-dependent property that requires orthogonal experimental validation, quantitative affinity metrics, and a documented audit trail to support reproducible research.
| Point | Details |
|---|---|
| Specificity is relative, not absolute | Specificity is always assay-dependent; validate in every application format you intend to use. |
| KO/KD controls are non-negotiable | Signal in a knockout or knockdown sample is by definition non-specific; run this control for every antibody lot. |
| Report KD with full assay conditions | Always state assay format, buffer, temperature, antibody format, and valency alongside any KD, EC50, or IC50 value. |
| Audit trail enables reproducibility | Document lot number, assay conditions, and all control results per lot to support troubleshooting and cross-lab reproducibility. |
| Mayflowerbio antibodies support validation | Mayflowerbio’s antibody catalog includes application-validated reagents with datasheet-level characterization to anchor your validation workflow. |
Why specificity validation is the most undervalued step in experimental design
The reproducibility crisis in biomedical research has many causes, but a disproportionate share of irreproducible antibody-based findings trace back to a single failure: the original researchers trusted vendor validation data without running their own controls. Vendor datasheets are generated under specific conditions, with specific cell lines, at specific antibody concentrations. Your experimental system is different. That gap is where specificity failures hide.
What strikes me most about the current state of antibody validation is how rarely negative results get published. A researcher who discovers that a widely cited antibody cross-reacts with a closely related paralog has generated genuinely important information. That information, if shared in a methods section or a repository like CiteAb, would save dozens of other labs from repeating the same mistake. The field’s reluctance to publish negative validation data is a structural problem, and it is one that individual researchers can address right now by including full validation records in supplementary materials.
The energy landscape framework for specificity is also worth internalizing. Specificity is not a binary property that an antibody either has or lacks. Every antibody sits somewhere on a continuum of binding free energies for its intended target and for every off-target it has ever encountered. Affinity maturation shifts that distribution, but it does not eliminate the tail. Running a single assay and calling an antibody “specific” is like measuring a person’s height once and calling it their permanent physical state. Conditions change. Assay formats change. The antibody’s behavior will change with them. Build your validation workflow around that reality, not around the hope that one clean western blot is the whole story.
Mayflowerbio supports your antibody validation workflow
Sourcing the right reagents is the first practical step in any validation workflow, and it is where a lot of time gets lost. Mayflowerbio’s antibody catalog covers research, infectious disease, and specialty targets, with application-specific validation data included at the product level so you can assess fit before ordering.
Beyond individual antibodies, Mayflowerbio’s AimPlex multiplex assays give you the orthogonal screening capacity to run high-content specificity checks across multiple analytes simultaneously, which is exactly what the validation workflow above calls for at the expression-panel step. The bioassay catalog also includes positive control reagents, blocking peptides, and assay kits that slot directly into the stepwise workflow described here. Every reagent purchase comes with access to Mayflowerbio’s US-based technical support team, which means you have a direct line to troubleshooting guidance when a lot behaves unexpectedly. Browse the full antibody catalog and request a datasheet for any product to start building your validation record.
This article is general scientific information and does not substitute for independent validation in your specific experimental system. Always confirm antibody performance under your own assay conditions.
Useful sources and further reading
The sources below are the primary references cited in this article. Consult them for protocol-level detail, primary data, and deeper methodological background.
-
The interaction of the antibody molecule with specific antigen — NCBI Bookshelf (Janeway’s Immunobiology). The authoritative structural account of CDRs, paratope geometry, and the molecular basis of specificity. Start here for the structural framework.
-
Specificity, polyspecificity, and heterospecificity of antibody-antigen recognition — PubMed review. Foundational taxonomy of specificity types; covers epitope mapping technique comparison including peptide arrays, alanine scanning, and structural methods.
-
Selecting and engineering monoclonal antibodies with drug-like specificity — PMC review. Covers biophysical profiling panels, SPR/BLI kinetics for KD measurement, and early-stage polyreactivity screening. Essential for therapeutic development contexts.
-
Polyreactivity and polyspecificity in therapeutic antibody development — PMC review. Definitive treatment of polyreactivity vs. polyspecificity, physicochemical drivers, and in vivo amplification of low-affinity off-targets.
-
Concise guidance on antibody validation and the need for independent verification — PMC. Practical guidance on end-user verification and audit-trail documentation; directly supports the validation workflow and reproducibility arguments in this article.
-
Specificity and Cross-Reactivity — NCBI Bookshelf — Immunology and Evolution of Infectious Disease. Covers the quantitative relationship between affinity, assay stringency, and measured specificity; useful for understanding how assay conditions change apparent cross-reactivity.
-
Quantifying antibody binding: techniques and therapeutic implications — mAbs, 2025. Comprehensive review of affinity measurement methods including SPR, BLI, and kinetic modeling; recommended for the quantitative metrics and assay selection sections.
-
Reconciling specificity and non-specificity in antibody binding: an energy landscape framework — Frontiers in Immunology, 2025. Conceptual framework placing specific and non-specific interactions on a binding free energy continuum; useful background for the perspective section and for teaching specificity concepts.
-
Antibody Specificity overview — ScienceDirect Topics. Accessible overview of classical biochemical assays and their limitations for detecting low-affinity off-target interactions.