
Matrix Effects in ELISA: Causes, Diagnosis, and Fixes
Matrix effects are interference from non-target components in a sample that skew ELISA readouts, either suppressing or inflating the true concentration of your analyte. If your recovery looks off, you’ll see it as one of two problems: under-recovery, where the assay reports less analyte than is actually present, or over-recovery, where it reports more. Either one wrecks your data if it goes unnoticed.
The fastest way to find out which one you’re dealing with is to run a spike-and-recovery experiment alongside serial dilutions on a handful of representative samples. That single afternoon of bench work tells you whether your matrix is a problem and lets you start establishing a minimum required dilution (MRD) before you commit to a full study.
- Under-recovery: matrix components are masking or degrading your analyte
- Over-recovery: cross-reactivity or non-specific binding is inflating signal
- Action: spike known amounts into your matrix, run serial dilutions, compare against buffer-only controls
TL;DR:
- Running spike-and-recovery experiments with individual samples helps identify whether matrix effects cause under- or over-recovery issues.
- Dilution until recovery and linearity fall within acceptable ranges establishes the minimum required dilution to prevent interference during analysis.
- Non-parallel dilution curves indicate matrix interference, while a rising measured concentration on dilution suggests a hook effect rather than interference.
- Using matrix-matched calibration, buffer exchange, or heterophilic blocking reagents can effectively reduce interference when serial dilution alone is insufficient.
- Proper documentation of validation steps and recovery data is essential for regulatory compliance and ensuring the reliability of assay results.
Table of Contents
- What Causes Matrix Interference in Antibody Assays?
- How Do You Detect Matrix Effects Before They Ruin a Study?
- What Mitigation Strategies Actually Reduce Matrix Effects?
- What Should You Document to Validate Your Fix?
- What Do Published Matrix Effect Studies Reveal About Common Pitfalls?
- How I’d Prioritize Fixes on a Tight Deadline
- Reagents and Support That Help You Fix Matrix Effects Faster
- Key Takeaways
- Sources
- FAQ
What Causes Matrix Interference in Antibody Assays?
Serum and plasma are dense biological soup, and several of their normal components happen to interfere with antibody binding. Albumin and other high-abundance proteins compete for binding sites or coat the plate nonspecifically. Complement proteins can degrade analytes or antibodies. Heterophilic antibodies, especially human anti-animal antibodies, bridge capture and detection antibodies even when no real analyte is present, producing false positives. Lipids and detergents alter surface tension and can disrupt binding kinetics, while extreme pH or high salt concentrations denature or destabilize both antibody and antigen.
The mechanisms fall into a few buckets: non-specific binding (something sticks where it shouldn’t), sequestration (the analyte gets bound up by a carrier protein and becomes invisible to your antibody), enzymatic degradation (proteases in the sample chew up your target before it’s measured), and viscosity effects (thick samples pipette and mix unevenly, throwing off precision).
- Serum and plasma: highest risk due to protein density and heterophilic antibodies
- Tissue lysates: variable pH, detergents from lysis buffer, and proteases
- Cell-culture supernatants: phenol red, serum supplements, and secreted proteases
Matrix risk callout: A peer-reviewed study across 11 murine tumor lysates found matrix effects significant enough to distort cytokine ELISA and multiplex results, and dilution reduced but did not eliminate the interference. That’s worth sitting with: even standard mitigation doesn’t guarantee a clean signal in every matrix.
How Do You Detect Matrix Effects Before They Ruin a Study?
Detecting matrix effects in ELISA comes down to three linked experiments: spike-and-recovery, dilutional linearity, and orthogonal comparison. Run them in that order, because each one either confirms or rules out what the previous one suggested.
- Spike-and-recovery. Add a known quantity of analyte at two or three concentrations (low, mid, high relative to your expected range) into several individual matrix samples, not a pool. Run parallel spikes in assay diluent as your reference. Calculate percent recovery as (measured minus endogenous) divided by spiked amount, times 100. Standard practice treats 80 to 120 percent recovery as acceptable, though tighter windows apply for regulated assays.
- Dilutional linearity. Serially dilute several samples (typically 1:2 through 1:16 or further) and plot measured concentration times dilution factor against dilution level. A flat line means your assay is behaving linearly. A line that trends up or down as you dilute is non-parallelism, a clear sign of matrix interference.
- Orthogonal verification. When recovery or linearity data looks ambiguous, cross-check a subset of samples against a second method, mass spectrometry or an alternate immunoassay platform, to confirm whether the discrepancy is real interference or assay-specific noise.
Real-world spike-and-recovery datasets rarely land in a tidy range. Published immunoassay literature shows recoveries frequently falling outside 80 to 120 percent depending on the cytokine and dilution tested, which is exactly why testing multiple individual samples matters more than testing one pooled sample. A pool can average out problems that would flag clearly in individual patients or animals.
| Diagnostic | What it reveals | Pass signal |
|---|---|---|
| Spike-and-recovery | Whether matrix suppresses or inflates signal | Recovery within an acceptable assay-specific range |
| Dilutional linearity | Whether interference scales with concentration | Flat line across dilution series |
| Orthogonal comparison | Whether the primary assay agrees with an independent method | Concordant values within expected variance |
What Mitigation Strategies Actually Reduce Matrix Effects?
Establishing your MRD is the first real decision point. Dilute a representative sample serially until recovery and linearity both fall inside your acceptance range, then set that dilution as your floor, never dilute less than the MRD in production runs. The trade-off is sensitivity: every dilution step pushes you closer to your assay’s lower limit of quantification, so if your analyte sits near the LOQ to begin with, heavy dilution isn’t free.
When dilution alone doesn’t clear the interference, several other levers are worth pulling:
- Matrix-matched calibration or specialized diluents. Running standards in a diluent that mimics your sample matrix, rather than plain buffer, corrects for background effects that a buffer-only curve misses. Bio-Rad’s optimization guidance recommends diluents like BUF049A or BUF037A alongside blocking buffers specifically to counter serum and plasma interference.
- Buffer exchange or desalting. Spin columns such as NAP-10 or Sephadex G25 move your sample into an assay-compatible buffer while preserving most proteins, often with far less dilution than a straight serial dilution would require. This is a strong option when your analyte is scarce and heavy dilution risks pushing it below detection, according to Cygnus Technologies’ application note.
- Selective depletion. Removing albumin or IgG from a sample before assay reduces competition for binding sites, useful in tissue lysates or serum where these proteins dominate.
- Heterophilic blocking reagents. Adding commercially available blocking reagents neutralizes human anti-animal antibodies before they can bridge your capture and detection antibodies, a common source of false positives described in interference reviews.
- Protocol tweaks. Extending or shortening incubation, adding extra wash steps, or increasing wash buffer detergent concentration can all reduce background without changing reagents.
Pro Tip: Before you swap antibody pairs or redesign the assay, try a matrix-matched diluent first. It’s the cheapest fix, takes one afternoon to test, and solves the majority of moderate interference cases without touching your validated antibody set.
If none of the above clears the interference, and recovery stays skewed even after dilution, blocking, and buffer exchange, it’s time to consider antibody re-selection or a different assay format entirely (switching from a sandwich ELISA to a competitive format, for instance, can sidestep certain heterophilic antibody problems).

What Should You Document to Validate Your Fix?
Regulatory reviewers and internal QA teams both want the same thing: a paper trail showing you found the interference, characterized it, and fixed it deliberately rather than by accident. That means recording your MRD determination, complete spike-and-recovery tables across all tested concentrations, your dilution linearity curves, coefficient of variation (CV) across replicates, and any non-parallelism you observed and how you resolved it.
- Record MRD with the serial dilution data that justified it, not just the final number.
- Report recovery percentages for every spike level tested, not only the passing ones.
- Log intra-assay and inter-assay CVs; most labs target under 10 to 15 percent CV, though acceptance bands vary by analyte and platform.
- Document any deviation from your acceptance range and the rationale for accepting or rejecting the run.
- Note lot numbers for antibodies and diluents used, since inter-lot variability can itself mimic a matrix effect.
For routine QC, run a matrix control (a pooled sample of known behavior) with every batch, and re-verify MRD whenever you switch antibody lots or move the assay to a new instrument.
- Keep raw recovery data, not just pass/fail summaries
- Flag any sample type not covered by your original validation before running it
- Include matrix validation records in method transfer packages between sites or instruments
What Do Published Matrix Effect Studies Reveal About Common Pitfalls?
Matrix effects are frequently mistaken for antibody failure or reagent degradation. Teams troubleshoot by replacing antibody lots or re-ordering kits, when the real culprit is sample composition all along. Running spike-and-recovery early avoids that expensive detour.
That misdiagnosis is one of the most common and costly mistakes in ELISA troubleshooting, and it’s backed by tumor lysate research showing matrix interference significant enough to distort cytokine readouts across nearly a dozen tissue types tested.
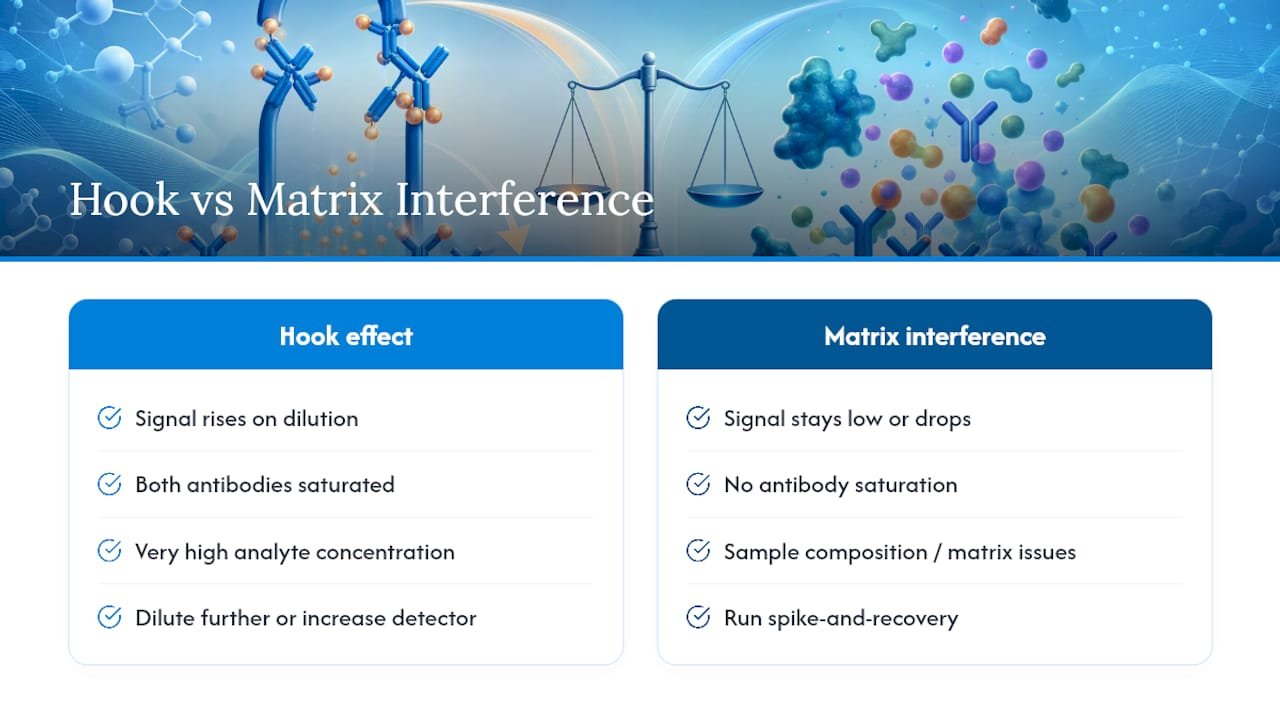
A related trap is confusing the hook effect with ordinary matrix under-recovery. The hook effect shows up when analyte concentration is so high it saturates both capture and detection antibodies simultaneously, producing a falsely low signal that looks identical to interference-driven under-recovery. The way to tell them apart: dilute the sample further. If measured concentration rises as you dilute, rather than staying flat or dropping, you’re looking at a hook effect, not matrix interference, and the fix is either further dilution or increasing detector antibody concentration.
How I’d Prioritize Fixes on a Tight Deadline
If I had one week to fix a suspect ELISA, I’d triage in this order: dilution first, since it’s fastest and cheapest. Spike-and-recovery second, to confirm the dilution actually worked. Blocking reagents or buffer exchange third, if dilution alone didn’t clear it. Assay redesign last, only after the first three have genuinely failed.
Reach out to technical support once you’ve already run spike-and-recovery. Bring your recovery percentages, dilution curves, and matrix type. That data turns a vague “my assay isn’t working” into a specific, solvable problem.
— Alina
Reagents and Support That Help You Fix Matrix Effects Faster
Choosing a validated antibody pair and a diluent designed for your matrix cuts weeks off the troubleshooting cycle described above. Mayflowerbio’s antibody catalog includes pairs selected for reduced cross-reactivity in complex serum and plasma matrices, and our bioassay kits come with published validation data covering recovery ranges and dilution linearity, so you’re not starting your MRD determination from zero.

If your samples come from tissue lysates or extracellular vesicle preparations rather than serum, matrix complexity runs even higher, and our exosome isolation tools are built to reduce that background before it ever reaches your plate. For teams weighing whether a single ELISA or a multiplex platform handles their matrix better, our AimPlex multiplex assays page walks through the trade-offs. When pre-analytical issues like hemolysis complicate your sample pool further, this hemolysis rejection threshold guide is a solid reference for setting rejection criteria before samples ever reach the bench. Browse our bioassay category to compare validation data across kits, or contact our technical support team directly with your spike-and-recovery numbers for a faster path to a working protocol.
Key Takeaways
Matrix effects distort ELISA results through non-specific binding, sequestration, and enzymatic degradation, and spike-and-recovery testing is the fastest way to confirm and fix them.
| Point | Details |
|---|---|
| Run spike-and-recovery first | Test multiple spike levels in individual samples before assuming reagent failure. |
| Establish MRD experimentally | Dilute until recovery and linearity both fall within acceptable range, then don’t go below it. |
| Watch for non-parallelism | A dilution curve that isn’t flat signals matrix interference, not assay error. |
| Distinguish hook effect from under-recovery | If concentration rises on further dilution, it’s a hook effect, not matrix interference. |
| Use validated reagents to save time | Mayflowerbio’s antibody pairs and bioassay kits include recovery and linearity data to speed up MRD determination. |
Sources
- Matrix effect in tumor lysates – Does it affect your cytokine ELISA and multiplex analyses?
- Spike and recovery experiments for ELISA validation: a complete guide to principles, methods and troubleshooting
FAQ
What Is a Matrix Effect in ELISA?
A matrix effect is interference caused by non-target components in a sample, such as proteins, lipids, or salts, that suppress or inflate the measured concentration of your analyte compared to its true value.
What’s the Difference Between Analyte and Matrix?
The analyte is the specific molecule you’re trying to measure; the matrix is everything else in the sample, serum proteins, lipids, salts, and other compounds, that can interfere with that measurement.
How Do You Calculate a Matrix Effect?
Run spike-and-recovery: subtract the endogenous concentration from the measured spiked concentration, divide by the amount spiked, and multiply by 100 to get percent recovery, with 80 to 120 percent generally considered acceptable.
What Is Matrix Interference?
Matrix interference is the mechanism behind a matrix effect, non-specific binding, heterophilic antibody bridging, enzymatic degradation, or viscosity changes that distort antibody binding kinetics during the assay.
Can Mayflowerbio Help Identify the Right Diluent for My Matrix?
Yes. Mayflowerbio’s validated antibody pairs and bioassay kits include recovery and linearity data across common matrix types, which shortens the diluent selection process during MRD determination.