ChIP qPCR Analysis: Excel Formulas, QC, and Constant Amount Fix
Use percent input as your primary method for chip qPCR analysis whenever you need quantitative, publication-ready comparisons across samples or conditions. Fold enrichment still earns a place in your workflow, but only as a quick signal-to-noise check against IgG or no-antibody controls, never as your main reported metric. If your qPCR reactions run on a constant DNA mass instead of a constant volume, a literature-backed constant-amount correction lets you calculate a valid percent input anyway.
TL;DR:
- Using percent input as the primary method ensures accurate, reproducible quantification across samples, especially when proper correction for reaction volume or DNA amount is applied.
- Converting the dilution factor to cycles using log2 is essential; failing to do so leads to incorrect percent input calculations and data misinterpretation.
- Fold enrichment is a useful qualitative check but is sensitive to variability in controls, so it should not be used as the main quantitative metric.
- Always include raw Cq values, primer efficiency data, and detailed normalization methods in reports to support valid comparisons and reproducibility.
- Consistent, validated reagents and precise conversion formulas are critical for reliable and comparable ChIP‑qPCR results over time.
Table of Contents
- What Is Percent Input in ChIP‑qPCR Analysis?
- Fold Enrichment: The Quick Check, Not the Final Answer
- Worked Calculations and Excel Formulas for ChIP‑qPCR
- Controls, QC Checks, and Where Variability Creeps In
- Choosing a Method and Reporting It Properly
- Author Perspective and Reagent Support for ChIP‑qPCR Workflows
- What I’ve Learned Running These Calculations
- Get the Right qPCR Reagents for Your ChIP Workflow
- Sources
- FAQ
What Is Percent Input in ChIP‑qPCR Analysis?
Percent input expresses how much of your starting chromatin (the input) ended up in the immunoprecipitated (IP) sample at a given genomic locus. It normalizes to the material you started with rather than to a background control that can shift from run to run, which is exactly why the ChIP-qPCR normalization literature treats it as the more reproducible choice for quantitative work.
The standard formula looks like this:
- Adjust the input Cq for the dilution factor: Adjusted Input Cq = Input Cq − log2(Dilution Factor)
- Calculate percent input: % Input = 2^(Adjusted Input Cq − IP Cq) × 100
Here’s where labs trip up: the dilution factor (DF) isn’t the cycle adjustment itself, it has to be converted. Since qPCR amplification doubles per cycle, you convert DF to cycles using log2, or equivalently ln(DF)/ln(2).
Statistic Callout: A 10% input dilution converts to a specific number of cycles based on the log2 of the dilution factor, which corresponds to the number of cycles you subtract from the input Cq before comparing it to the IP Cq, as explained in worked laboratory practical on ChIP‑qPCR methodology.
One caveat: this formula assumes constant-volume qPCR reactions. If your protocol uses a fixed DNA mass per well instead (common when input material is scarce), the raw dilution factor no longer reflects true starting material accurately, and you need the constant-amount correction covered later in this article.
Fold Enrichment: The Quick Check, Not the Final Answer
Fold enrichment tells you how much more signal your target locus shows in the IP sample compared to a negative control, usually an IgG pulldown or a no-antibody reaction. It’s calculated with the standard ΔCt method: ΔCt = Ct(IgG) − Ct(IP), then fold enrichment = 2^ΔCt.
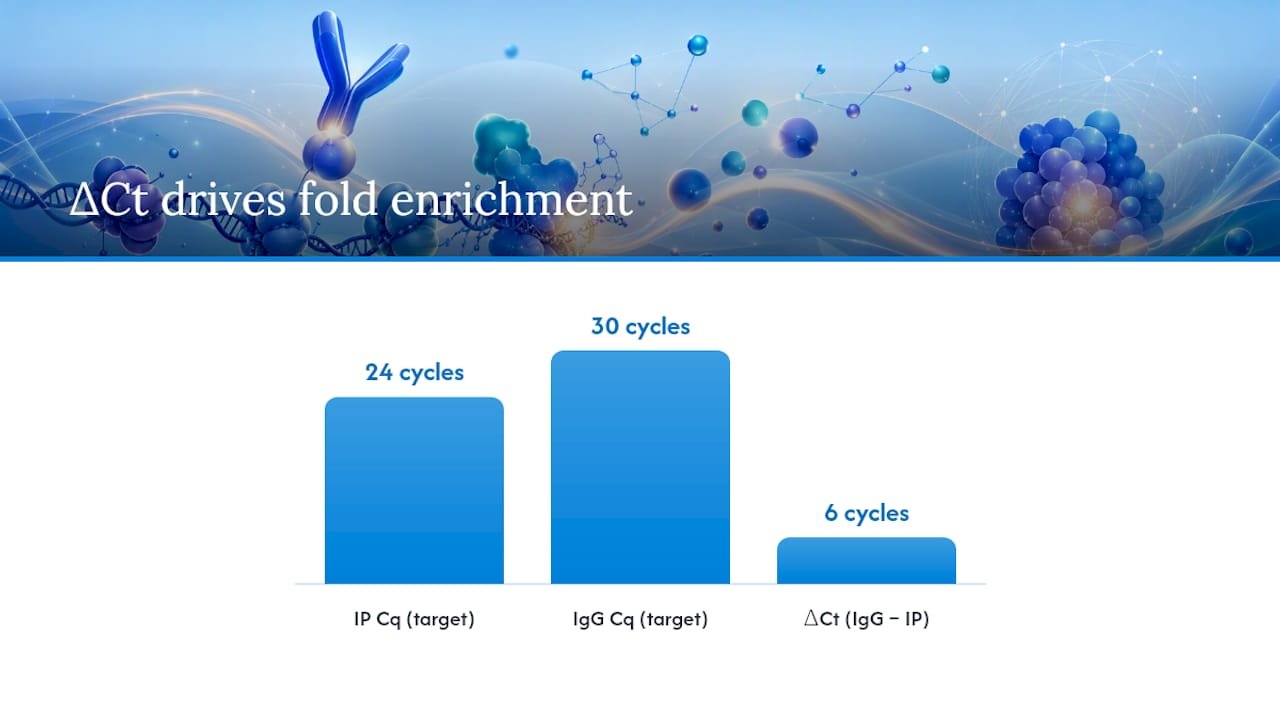
Say your IP Cq at a target promoter is 24, and your IgG control Cq at the same locus is 30. ΔCt = 6, so fold enrichment = 2^6 = 64. That looks impressive on a slide, but it tells you nothing about how it compares to a different chromatin prep run three months later.
The problem is the denominator. IgG and no-Ab backgrounds vary lab to lab and even run to run, which makes fold enrichment sensitive to factors that have nothing to do with your biology:
- Batch-to-batch variability in antibody lots and IgG background signal
- Inconsistent chromatin shearing efficiency between preparations
- Operator-dependent pipetting differences that shift the negative control baseline
- Poor comparability across experiments performed on different days or by different technicians
Use fold enrichment to sanity-check that your antibody actually pulled down more signal than background. Don’t use it as your headline statistic in a manuscript.
Worked Calculations and Excel Formulas for ChIP‑qPCR
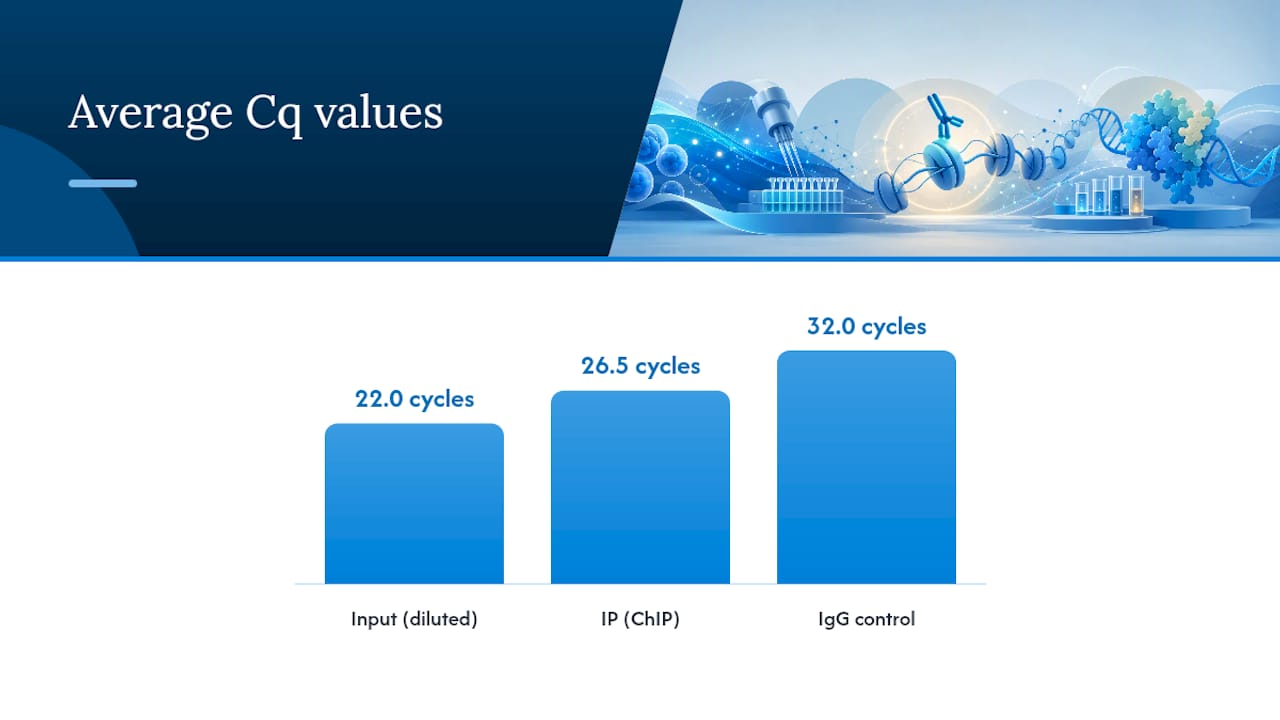
Here’s a small example dataset you can drop straight into a spreadsheet. Assume triplicate qPCR reactions with a 1:100 input dilution (DF = 100).
- Average IP Cq: 26.5
- Average Input Cq (diluted): 22.0
- Average IgG Cq: 32.0
Step-by-step:
- Convert DF to cycles: log2(100) = 6.644
- Adjusted Input Cq = 22.0 − 6.644 = 15.356
- % Input = 2^(15.356 − 26.5) × 100 = 2^(−11.144) × 100 ≈ 0.044%
- Fold enrichment (vs. IgG) = 2^(32.0 − 26.5) = 2^5.5 ≈ 45.3
Excel-ready formulas (assuming Input Cq in cell B2, DF in C2, IP Cq in D2, IgG Cq in E2):
- Adjusted Input Cq:
=B2-LOG(C2,2) - % Input:
=(2^(F2-D2))*100(where F2 is the adjusted input Cq) - Fold enrichment:
=2^(E2-D2)
For replicates, average the raw Cq values first, then run the calculation once on the averages rather than averaging three separate percent-input outputs, which compounds noise. Flag any well marked “undetermined” and exclude it from averaging rather than substituting an arbitrary high Cq value, since that artificially deflates your percent input.
Pro Tip: Keep your raw Cq values, not just the calculated percent input, in a supplemental table. Reviewers increasingly ask for it, and it lets you re-run the math if you later switch normalization methods.
Controls, QC Checks, and Where Variability Creeps In
Reliable chip qPCR analysis depends on running the right controls every single time, not just when something looks off. At minimum, every experiment needs an input sample, an IgG or no-antibody control, a no-template control (NTC), and at least one known positive and negative locus.
On the qPCR side, primer validation matters as much as the ChIP itself. Run a calibration line, a serial dilution series of your input DNA, before trusting any primer set with real samples.
Statistic Callout: Aim for primer efficiency in the 90 to 110 percent range, with amplicon lengths between roughly 80 and 150 base pairs, according to protocol guidance on ChIP-qPCR optimization. Efficiency outside that window means your Cq values won’t scale linearly with template amount, which throws off every downstream calculation.
The main sources of variability worth watching:
- Immunoprecipitation efficiency, which shifts with antibody lot and chromatin quality
- DNA recovery losses during washing and elution steps
- Pipetting accuracy, especially at low input dilution volumes where small errors compound
For SYBR-based assays, always check the melting curve for a single clean peak. A shoulder or double peak signals primer dimers or off-target amplification, and any percent input calculated from that reaction should be treated with suspicion.
Choosing a Method and Reporting It Properly
Match the method to the question. If you’re comparing enrichment across treatment conditions, time points, or genotypes for publication, percent input is the right call. If you just need to confirm your antibody worked before running the full panel, fold enrichment against IgG is faster and fine for that narrow purpose. When your protocol runs qPCR on a fixed DNA mass rather than a fixed volume, apply the constant-amount percent input correction, which has been mathematically validated to produce results equivalent to traditional constant-volume calculations.
Whatever method you choose, report it completely:
- Raw Cq values for IP, input, and IgG/no-Ab controls
- Primer efficiency and calibration line data for each primer set
- Input dilution factor and exactly how it was applied in the calculation
- Number of biological and technical replicates
- Statistical method used to compare conditions
| Reporting item | Why it matters |
|---|---|
| Raw Cq values | Lets reviewers verify or recalculate normalization |
| Primer efficiency | Confirms linear, quantifiable amplification |
| Dilution factor and method | Shows how percent input was derived |
| Replicate count | Supports statistical validity of conclusions |
Include the raw Cq table as supplemental material by default. It costs you nothing and saves a round of reviewer questions later.
Author Perspective and Reagent Support for ChIP‑qPCR Workflows
Alina has spent years reviewing ChIP‑qPCR datasets across academic and industry labs and has seen percent input miscalculations sink otherwise solid experiments. For multiplexed detection or probe-based assays, a reliable chemistry matters as much as your math. Mayflowerbio’s HOT FIREPol Multiplex qPCR Mix supports multiplex ChIP‑qPCR detection. Our team can walk through primer or chemistry questions specific to your assay.
What I’ve Learned Running These Calculations
The single most common mistake I see isn’t a bad formula, it’s an inconsistent one. A tech converts dilution factor to cycles one way in January and a different way in June, and suddenly two datasets in the same paper aren’t comparable.
Pro Tip: Write your exact conversion formula into the plate map template itself, not just the lab notebook. Anyone repeating the assay a year later should be able to reproduce your numbers without asking you first.
— Alina
Get the Right qPCR Reagents for Your ChIP Workflow
Consistent chip qPCR analysis starts with reagents that behave the same way every run, and that’s where a lot of labs lose reproducibility before the math even enters the picture. Mayflowerbio supplies qPCR mixes built for exactly this kind of quantitative work, including the HOT FIREPol family for standard and multiplex detection.

Beyond the mix itself, our other PCR reagents cover the buffers, polymerases, and consumables that support a full ChIP‑qPCR pipeline from chromatin prep through amplification. If you’re troubleshooting primer efficiency, multiplexing strategy, or reagent compatibility for a specific antibody or locus, browse our qPCR and RT-qPCR resources or reach out to our technical support team directly. They can help you match a mix chemistry to your assay design before you run your next plate.
Sources
- A novel method for the normalization of ChIP-qPCR data
- Chromatin immunoprecipitation: optimization, quantitative analysis and data normalization
- A laboratory practical illustrating the use of the ChIP‑qPCR method
FAQ
What Is the Difference Between Percent Input and Fold Enrichment?
Percent input normalizes IP signal to the amount of starting chromatin, while fold enrichment compares IP signal to a negative control like IgG. Percent input is generally more reproducible for quantitative comparisons across experiments.
How Do You Convert Input Dilution Factor to Cycles?
Take log2 of the dilution factor.
What Primer Efficiency Range Is Acceptable for ChIP‑qPCR?
Aim for primer efficiency within a recommended range close to 100 percent, confirmed with a calibration line using serial dilutions of input DNA before running experimental samples, as suggested by protocol guidance on ChIP-qPCR optimization.
Can I Use Percent Input if My qPCR Reactions Use a Constant DNA Mass?
Yes, a validated constant-amount correction adjusts the dilution factor calculation so percent input remains accurate even when reactions use a fixed DNA mass rather than a fixed volume.
Which Controls Are Required for Reliable ChIP‑qPCR Data?
You need an input sample, an IgG or no-antibody control, a no-template control, and at least one confirmed positive and negative genomic locus for every experiment.