

Validate Reference Genes Under MIQE 2.0 for qPCR Normalization in Labs
For gene-expression qPCR, the most defensible approach is to validate a panel of candidate reference genes for your specific experimental system, select a small set of reference genes that demonstrate stable expression under your specific conditions, and normalize using their geometric mean. Report the validation data, primer efficiencies, and Cq method per MIQE 2.0. That combination minimizes the bias baked into any workflow that leans on a single unvalidated housekeeping gene like GAPDH or ACTB.
TL;DR:
- Validating two to three reference genes tailored to your experiment and reporting their stability metrics is essential for reliable normalization.
- Using generic housekeeping genes like GAPDH or ACTB without validation can introduce bias, as their expression often shifts under specific conditions.
- Employing efficiency-corrected calculations for each sample prevents the bias inherent in assuming 100% PCR efficiency and improves data accuracy.
- Combining geNorm, NormFinder, and BestKeeper algorithms helps identify the most stable reference genes, especially when their rankings agree across methods.
- Consistent reagent quality and thorough documentation, including raw data and efficiency metrics, are critical for MIQE compliance and reproducibility in qPCR workflows.
Table of Contents
- What Are the Main qPCR Normalization Methods?
- Why Does Reference-Gene Validation Matter Per Experiment?
- How Do geNorm, NormFinder, and BestKeeper Actually Differ?
- A Step-by-Step Workflow for Validating and Normalizing Your qPCR Data
- Why ΔCq and ΔΔCq Calculations Can Mislead You
- What Belongs in a MIQE-Compliant Normalization Report?
- Common Normalization Mistakes and How to Catch Them Early
- Mayflower Bioscience Resources That Support Reproducible qPCR Normalization
- Scaling Normalization Across a Core Facility
- How Mayflower Bioscience Can Help You Standardize Your qPCR Workflow
- Sources
- FAQ
What Are the Main qPCR Normalization Methods?
Every normalization strategy tries to solve the same problem: separating real biological signal from technical noise introduced during sample prep, reverse transcription, and amplification. The method you pick depends on your platform, your sample type, and how many targets you’re running.
Endogenous reference-gene normalization uses one or more internal genes, assumed to be stably expressed across your experimental conditions, as a denominator for your target Cq values. This is the default for targeted gene-expression panels and remains the most versatile option for most bench qPCR work, provided the reference genes are actually validated rather than assumed stable.
Global mean normalization averages expression across a large number of assayed genes (often used in high-throughput qPCR arrays or panels with 90+ targets) and uses that mean as the normalizer. It works well when you have enough genes to dilute the effect of any single unstable one, but it’s impractical for a four-gene qPCR panel.
Total nucleic acid normalization standardizes input based on total RNA or DNA mass measured before reverse transcription. It’s simple and fast, but it doesn’t correct for RT efficiency differences or degradation, so it’s rarely sufficient on its own.
Spike-in controls add a known quantity of synthetic RNA or DNA before extraction or reverse transcription, giving you a technical anchor independent of biological variation. These are common in RNA-seq cross-sample normalization and in situations where endogenous genes are all suspected to shift (e.g., global transcriptional shutdown after certain treatments).
Quick summary of context fit:
- Endogenous multi-gene normalization: best default for targeted qPCR panels of 1 to 20 genes.
- Global mean normalization: suited to large custom panels or array-based qPCR.
- Total RNA/DNA normalization: useful as a QC step, not a standalone method.
- Spike-in controls: valuable when biological treatment may alter most endogenous transcripts.
Why Does Reference-Gene Validation Matter Per Experiment?
MIQE 2.0 replaced the old tiered reporting system with a single Yes/No checklist, and one of its central demands is that reference gene stability be validated for the specific experimental system you’re running, not inherited from a prior study or textbook assumption. A gene that behaves as a stable reference in liver tissue can swing wildly under hypoxia, drug treatment, or in a different cell line entirely.
The uncomfortable statistic: GAPDH, ACTB, and 18S rRNA, the three most commonly used “default” housekeeping genes in published qPCR studies, are each known to shift under specific treatment conditions (hypoxia, proliferation signals, ribosomal biogenesis changes), which is exactly why MIQE 2.0 treats system-specific validation as non-negotiable rather than optional.
Skipping validation doesn’t just add noise. It can invert your conclusions. If your reference gene is mildly upregulated by the same treatment that upregulates your target, your normalized fold change will be artificially compressed. If the reference gene is downregulated, you’ll see an inflated effect that doesn’t exist. Neither error announces itself. The data still looks clean, the curves are still sigmoidal, and the Cq values still cluster tightly. The bias is invisible unless you’ve actually tested the reference genes under your own conditions.
The minimal metadata to collect and keep, per MIQE 2.0 expectations, includes:
- RNA integrity metrics (RIN or a comparable degradation check) for every sample batch.
- Exact RNA or cDNA input amounts used in each reaction.
- Per-assay PCR efficiency, ideally from a dilution series or LinRegPCR estimation.
- The Cq determination method (second derivative, threshold-based, etc.) and software version.
None of this is exotic lab work. It’s mostly documentation discipline applied at the point of data collection, which is precisely when it’s easiest to skip and hardest to reconstruct later.
How Do geNorm, NormFinder, and BestKeeper Actually Differ?
These three algorithms all try to answer the same question (which candidate genes are the most stable across your samples) but they get there through different math, and that difference matters when you’re picking a panel.
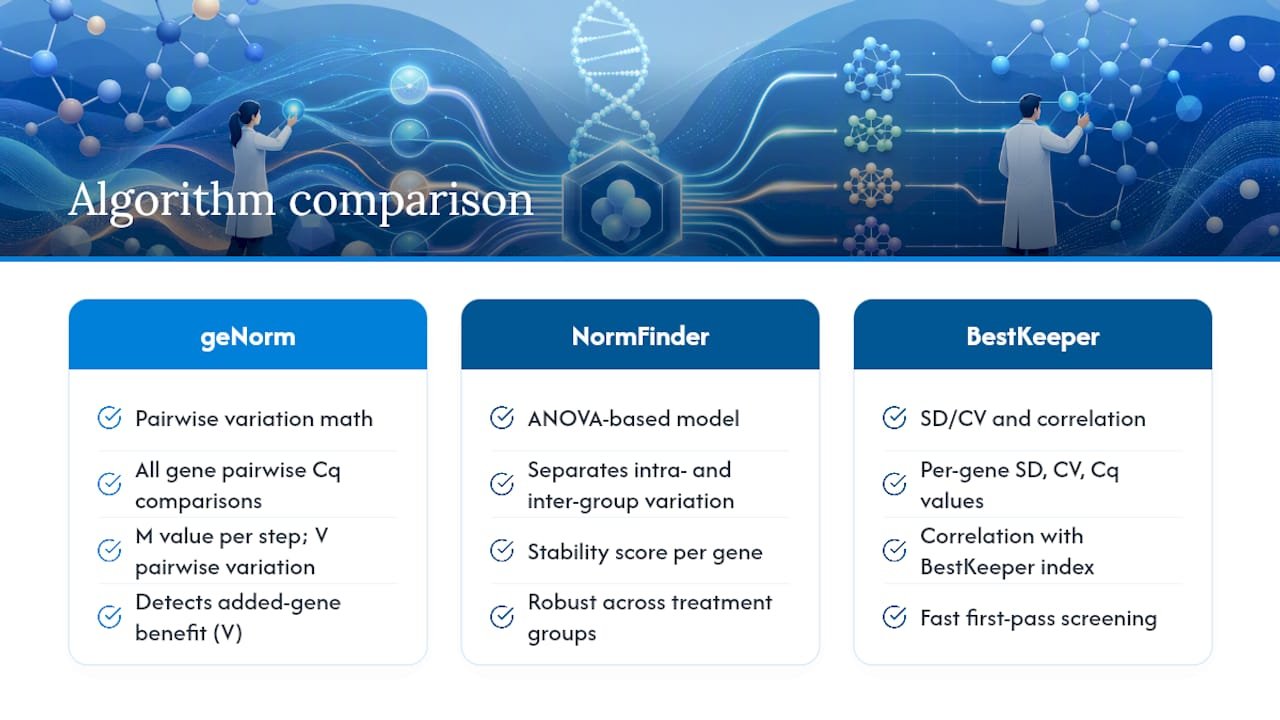
geNorm calculates pairwise variation between every candidate gene and every other candidate gene, then iteratively excludes the least stable one, generating an M value for each gene at each step. It also produces a pairwise variation value (V) that tells you whether adding another reference gene meaningfully improves stability, or whether two is already enough. The catch: geNorm can mis-rank co-regulated genes as artificially stable, because if two genes move together, their pairwise variation looks small even though both are actually unstable relative to the true biological baseline.
NormFinder takes an ANOVA-based approach, modeling both intra-group and inter-group variation separately. This makes it noticeably more robust than geNorm when your samples span multiple treatment groups or heterogeneous conditions, since it can detect a gene that looks stable within one group but drifts between groups, something pairwise-variation methods can miss entirely.
BestKeeper relies on standard deviation and coefficient of variation for each candidate gene, then correlates each gene’s Cq values against a calculated BestKeeper index. Common screening thresholds are an SD under 1, a CV under 2%, and a Pearson correlation of at least 0.9 with p < 0.05. It’s fast and useful for an early pass, but it’s sensitive to outlier samples in a way the other two are not.
Pro Tip: Don’t run one algorithm and call it done. Run at least two, ideally all three, and look for genes that rank well across methods rather than genes that only look good under one model’s assumptions.
Newer ensemble and machine-learning-informed tools, including approaches described for high-throughput and cancer-biology datasets, can improve robustness further when you’re working with noisy or large-panel data, though they add a layer of computational complexity that a small single-lab study usually doesn’t need.
A Step-by-Step Workflow for Validating and Normalizing Your qPCR Data
You don’t need a bioinformatics core to run this properly. Here’s a pipeline you can start this week with standard bench equipment and open-source analysis tools.
-
Run pre-RT quality control. Check RNA integrity (RIN via capillary electrophoresis or an equivalent), treat with DNase to remove genomic DNA contamination, and standardize input amounts across every sample before reverse transcription. Skipping this step is the single most common reason labs see inconsistent reference-gene rankings later.
-
Select a candidate reference-gene panel from diverse functional classes. Pick 5 to 8 candidates that aren’t co-regulated. Mixing genes involved in metabolism, cytoskeleton, ribosomal function, and transcriptional machinery reduces the risk that a whole cluster shifts together under your treatment.
-
Run a pilot qPCR across representative samples. Include every major group in your design (treatments, timepoints, biological replicates) and capture raw Cq values. Estimate amplification efficiency for each assay using a dilution curve or LinRegPCR rather than assuming 100%.
-
Apply at least two, preferably three, stability algorithms (geNorm, NormFinder, BestKeeper) to the pilot data and compare rankings. Choose the two or three genes that perform consistently well across methods, then compute their geometric mean as your normalization factor, a practice supported across reference-gene selection literature.
-
Calculate efficiency-corrected, per-sample normalized quantities, then run your statistics on those per-sample values before averaging into group means. Averaging too early hides variance that your statistical test needs to see.
Pro Tip: Use the exact same cDNA batch for your stability-testing pilot that you’ll use for your actual target quantification. Stability rankings generated from a different prep batch don’t reliably transfer, even from the same tissue source.
Why ΔCq and ΔΔCq Calculations Can Mislead You
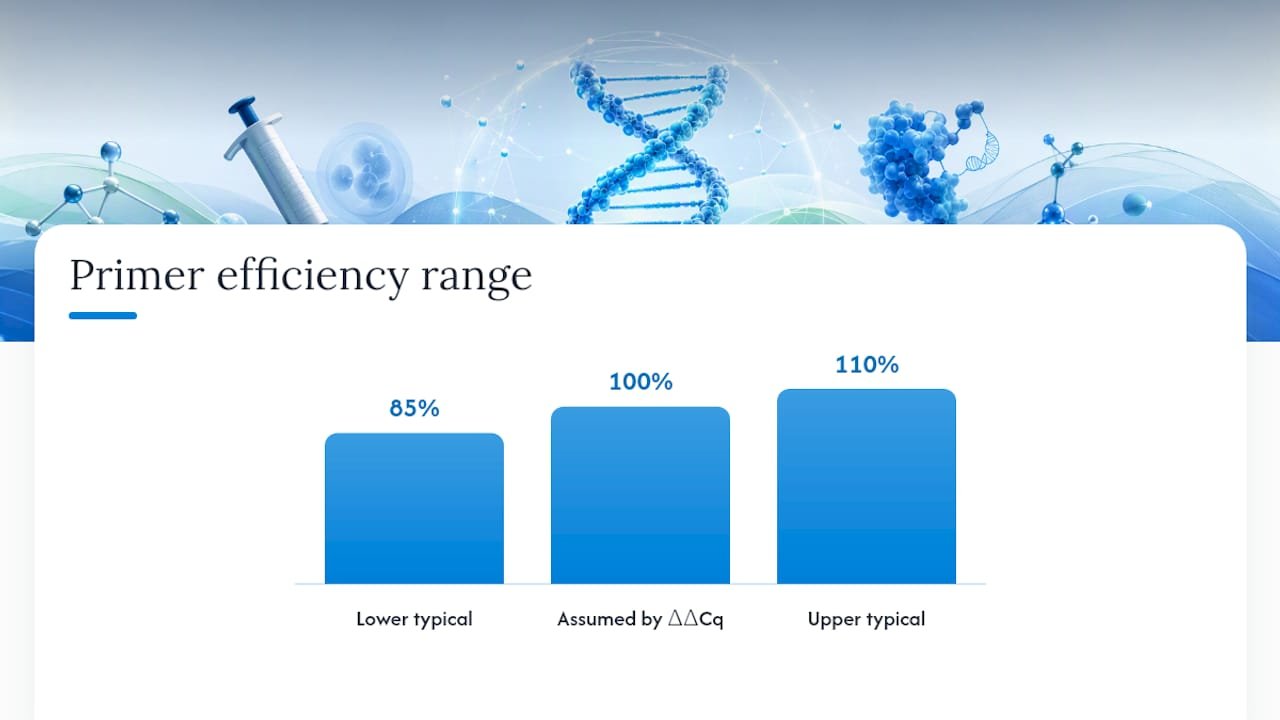
The classic ΔΔCq formula assumes every assay amplifies at exactly 100% efficiency, doubling with each cycle. In practice, primer efficiencies commonly range from 85% to 110%, and that gap between assumed and actual efficiency compounds across every cycle of the run. The result is a Cq-dependent bias: samples with lower starting quantity (higher Cq) get distorted more than samples with high starting quantity, because the efficiency error accumulates over more cycles.
The fix isn’t complicated, but it does require an extra calculation step. Instead of using raw Cq differences, calculate target and reference quantities per sample using each assay’s actual measured efficiency, then take the ratio of those efficiency-corrected quantities. Analyze those per-sample ratios statistically before you ever compute a group average. This preserves biological variance across replicates and avoids baking a systematic efficiency error into your fold-change numbers.
What to report alongside your normalized values:
- Amplification efficiency percentage for every assay, target and reference alike.
- R² from the standard curve or dilution series used to calculate that efficiency.
- Whether efficiency came from a dilution series or from software-based estimation like LinRegPCR.
Efficiency-corrected, per-sample normalization is the practice recommended when assay efficiencies differ, which MIQE 2.0’s efficiency-correction guidance treats as standard rather than optional once your efficiencies drift outside a tight range.
What Belongs in a MIQE-Compliant Normalization Report?
Reviewers increasingly expect a specific set of disclosures before they’ll accept qPCR-based gene expression claims, and reconstructing this information after the fact from memory is nearly impossible. Build the habit of logging it at generation time.
Your methods section and supplementary files should include:
- The identity of validated reference genes and their stability metrics (M values, NormFinder variance, or BestKeeper SD/CV) from the algorithms you actually ran.
- Per-assay PCR efficiency and R² for every primer set, target and reference genes alike.
- The Cq determination method and software used.
- Raw Cq tables, ideally exported in RDML format for portability across analysis software.
- RNA integrity numbers and exact input amounts for every sample batch.
A minimal supplementary package that satisfies most reviewers contains the raw Cq table, the efficiency and R² table, the normalization script or R code you ran, and the final normalized per-sample values. Package all four together, even for a routine submission. It’s far less work than reconstructing them under review-deadline pressure six months later.
Common Normalization Mistakes and How to Catch Them Early
Watch for reference genes whose Cq values swing more than a cycle or two across your sample set, unusually high SD or CV flags from BestKeeper, or wildly inconsistent efficiencies between your target and reference assays. These are the three most common early warning signs that something in your normalization is broken.
Before rerunning anything, inspect the raw Cq distribution for outlier wells, confirm efficiencies with a fresh dilution series, and check whether adding one or two more candidate reference genes changes the stability ranking meaningfully.
- If the instability traces back to a handful of outlier wells, re-run just those wells rather than the whole plate.
- If instability is systemic across a treatment group, discard that batch and re-extract; re-normalizing noisy raw data won’t fix a degraded RNA problem.
Pro Tip: When in doubt, add reference genes rather than removing data. A fourth candidate that stabilizes your geometric mean is usually cheaper than repeating an entire experimental arm.
Mayflower Bioscience Resources That Support Reproducible qPCR Normalization
Consistent chemistry matters as much as consistent math. Mayflowerbio’s qPCR and RT-qPCR reagents cover the mixes and enzymes that reduce lot-to-lot efficiency drift, one of the quieter causes of unstable reference-gene rankings between experiments. Pairing a stable master mix with a documented reverse-transcription reagent set keeps your pilot validation data relevant to your production runs, instead of watching efficiencies shift when you switch lots midstream.
For labs building or updating a MIQE-aligned reporting workflow, Mayflowerbio’s guidance on molecular biology data reporting walks through what a normalization metadata package should contain. Labs choosing between reagent options for a new panel, or troubleshooting an efficiency mismatch between target and reference assays, can access technical support teams for help matching reagents to their specific assay design.
Scaling Normalization Across a Core Facility
Central validation panels work for routine, high-volume assays run under stable conditions. Anything involving a new cell line, treatment, or tissue needs its own per-project validation. Skipping that step to save time is where reproducibility problems start.
— Alina
How Mayflower Bioscience Can Help You Standardize Your qPCR Workflow
Reagent inconsistency undermines careful reference-gene work before you even reach the analysis stage. If your primer efficiencies drift between lots, your stability rankings from last quarter won’t hold up this quarter, no matter how carefully you ran geNorm or NormFinder the first time. Mayflowerbio’s qPCR and RT-qPCR product line is built around that consistency problem: stable master mixes and RT reagents that keep your validated efficiency data relevant from one experiment to the next.

If you’re setting up a new normalization pipeline or troubleshooting inconsistent reference-gene behavior, Technical support teams can sometimes help match reagents to assay designs and sample types. Browse the other PCR reagents available for your panel, or reach out directly to talk through your specific experimental system before your next production run.
Sources
Start with MIQE 2.0 and the MIQE reporting checklist for primary reference.
- MIQE 2.0: Practical implementation of minimum standard guidelines for fluorescence-based quantitative real-time PCR experiments
- Careful selection of reference genes is required for reliable performance of RT-qPCR in human normal and cancer cell lines
FAQ
What Is the Best Normalization Method for qPCR Gene Expression?
The most reliable approach validates two to three reference genes for your specific experimental system and normalizes target Cq values using their geometric mean, reported according to MIQE 2.0.
How Many Reference Genes Should I Use for Normalization?
Most validation studies recommend at least two, and preferably three, validated reference genes rather than relying on a single housekeeping gene.
Are GAPDH and ACTB Reliable Housekeeping Genes?
Not automatically. Both are known to shift under certain treatment conditions, which is why MIQE 2.0 requires validating stability for your own experimental system rather than assuming these traditional genes are stable by default.
What’s the Difference Between geNorm and NormFinder?
geNorm ranks genes using pairwise variation and can mis-rank co-regulated genes as stable, while NormFinder uses an ANOVA-based model that better handles heterogeneous, multi-group sample sets.
Why Is ΔΔCq Considered Biased?
The ΔΔCq formula assumes 100% PCR efficiency for every assay, and real efficiencies typically range from 85% to 110%. That gap introduces a Cq-dependent bias that efficiency-corrected, per-sample normalization avoids.
What Should I Report for MIQE 2.0 Compliance?
Report validated reference genes and their stability metrics, per-assay PCR efficiency and R², the Cq determination method, RNA integrity numbers, and raw Cq data, ideally as a supplementary package alongside your manuscript.