
Get 90–110% qPCR Efficiency: Calculate With One Validated Curve for Labs
The formula is E = 10^(−1/slope) − 1, which can be converted to a percentage efficiency by multiplying by 100… A slope of about −3.32 corresponds to near-perfect doubling efficiency, since that’s exactly one doubling per cycle, and most labs treat efficiencies within an acceptable range as valid, typically near perfect doubling. Before accepting the number, check three things: standard-curve linearity, replicate consistency, and clean no-template controls. If any of those look shaky, the efficiency value in front of you is not trustworthy yet.
TL;DR:
- A slope of −3.32 indicates near-perfect doubling efficiency at 100%, but values outside the 90–110% range require verifying the standard curve’s linearity and replicates.
- Most efficiency calculations rely on a linear standard curve with an R² above 0.99 across multiple dilutions and replicates spanning at least four to five orders of magnitude.
- Efficiency estimates are sensitive to pipetting, reagent quality, and instrument variability, so multiple runs and proper calibration are essential for accuracy.
- Efficiencies above 100% often result from contamination or pipetting errors, while those below 90% suggest primer issues, inhibitors, or degraded reagents.
- A single well-validated standard curve with adequate dilution steps and replicates is more reliable than multiple rushed, underpowered curves for assessing qPCR efficiency.
Table of Contents
- qPCR Efficiency Calculation: The Formula and Worked Examples
- Building a Standard Curve You Can Actually Trust
- What the Efficiency Number Actually Tells You
- Getting a Precise Efficiency Estimate: Replicates, Volumes, and Instrument Effects
- When Efficiency Numbers Go Wrong: Common Causes and Fixes
- Mayflower Bioscience Resources for Reliable qPCR Work
- Why I’d Rather See One Good Curve Than Five Bad Ones
- Reagents and Support for Building Your Standard Curve
- Sources
- FAQ
qPCR Efficiency Calculation: The Formula and Worked Examples
Every efficiency value starts with the slope of a plot of Cq against log10 of your input concentration. From there, the amplification factor is 10^(−1/slope), and converting that to a percentage just means subtracting 1 and multiplying by 100.
The math traces back to a simple biological fact: perfect PCR doubles the amount of product every cycle, as explained in this plain-language guide to DNA amplification. A 10-fold dilution series should separate samples by 3.32 cycles if the reaction is doubling perfectly each round, and that relationship is what the slope-to-efficiency equation is built on.
Two examples make this concrete:
- A slope of −3.32 gives an amplification factor of 10^(1/3.32) = 2.00, or 100% efficiency.
- A slope of −3.50 gives 10^(1/3.50) = 1.93, which works out to roughly 93% efficiency.
Most qPCR software reports this automatically, but if you’re checking a calculator or building your own spreadsheet, the equivalent expression is Efficiency = −1 + 10^(−1/slope). Vendor calculators, including the one from Thermo Fisher Scientific, will spit out a number instantly. They will not tell you whether that number came from a garbage curve. That part is on you.
Building a Standard Curve You Can Actually Trust
A slope is only as good as the curve it came from. Rushing this step is the single most common reason efficiency numbers end up unbelievable.
- Design the dilution series. Ten-fold dilutions across multiple concentrations, spanning at least four to five orders of magnitude, give a regression with enough range to trust.
- Run the reactions and pull Cq values. Include replicates at every concentration rather than a single well per dilution point.
- Plot Cq against log10 of the starting quantity. The relationship should look like a straight line, not a curve or a scatter.
- Run linear regression and check R². A value above 0.99 is the usual bar; anything lower means the slope you’re about to extract isn’t reliable.
- Extract the slope, compute efficiency, and record everything. Slope, R², dynamic range, and how the value fed into downstream quantification all belong in your methods section, in line with MIQE reporting guidelines.
- Widen or narrow the range if the ends misbehave. A curve that flattens at high concentration or wanders at low concentration should be trimmed, then re-fit on the range that actually behaves linearly.
What the Efficiency Number Actually Tells You
A slope of −3.32 means 100% efficiency because the reaction is doubling template with every single cycle. That sounds like a technicality until you run the math across a full 30 to 40 cycle run: small efficiency differences don’t stay small, they compound exponentially.
Efficiency differences across many cycles of amplification can produce substantial differences in final amplicon number, enough to distort fold-change results — enough to distort a fold-change result that looks clean on paper, according to research on efficiency correction in qPCR analysis.
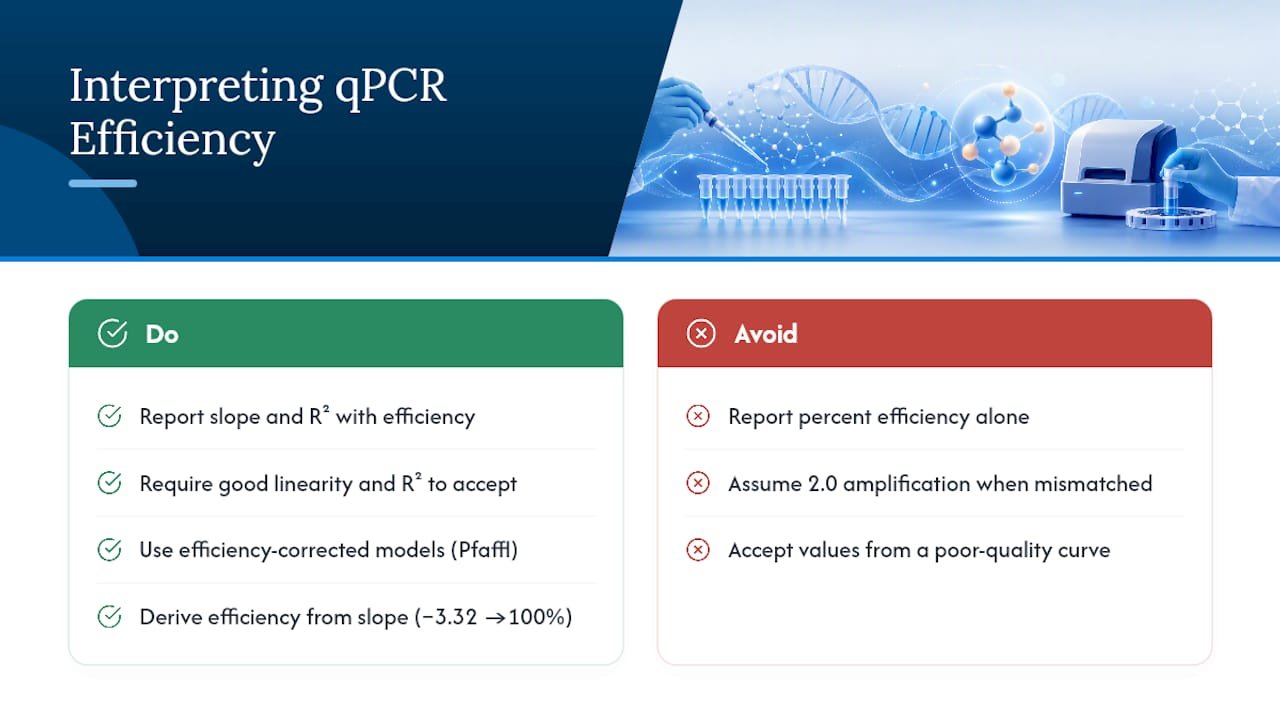
The standard operational guideline is to accept efficiencies in a generally accepted efficiency range, provided linearity and R² also check out. A value technically inside that window built on a poor curve is still a poor result, so report the slope and R² alongside the percentage, not the percentage alone.
When your target gene and reference gene don’t have matching efficiencies, don’t default to assuming both amplify at exactly 2.0 per cycle. Efficiency-corrected models, most commonly the Pfaffl method, adjust for that mismatch and produce far more defensible fold-change numbers than a fixed ΔΔCq calculation.
Getting a Precise Efficiency Estimate: Replicates, Volumes, and Instrument Effects
Most labs treat efficiency as a fixed property of an assay. It isn’t. It’s an estimate, and estimates carry uncertainty that depends heavily on how the dilution series was built.
Monte Carlo modeling on standard-curve data found that a single-replicate curve run on one plate can carry a confidence interval as wide as 42.5%. That’s not a rounding error. It’s the difference between an assay that looks fine and one that’s quietly biasing every quantification downstream.
A few concrete adjustments shrink that uncertainty substantially:
- Use multiple dilution steps (several concentrations if you’re diluting straight from stock) to anchor the regression.
- Run multiple qPCR replicates per concentration rather than one, since replicate count is the single biggest lever on confidence interval width.
- Use transfer volumes of multiple microliters where the protocol allows; very small volumes can introduce sampling error that shows up directly as slope noise.
- Treat efficiency as instrument-dependent. A curve measured on one qPCR platform doesn’t automatically transfer to another; measure once per instrument and use inter-plate calibrators for run-to-run correction instead of rebuilding a minimal curve every time.
Pro Tip: If you’re running a multi-plate study, resist the temptation to squeeze a two-point “efficiency check” into a corner of every plate. A single well-powered curve, built once and validated properly, beats a dozen underpowered ones scattered across your project.
The assay setup guide for optimized PCR workflows walks through dilution planning and pipetting practices in more detail if you’re setting this up from scratch.
When Efficiency Numbers Go Wrong: Common Causes and Fixes
Efficiency creeping above 100% usually points to pipetting or dilution errors that inflate the apparent doubling rate, contamination adding unintended template, a non-linear high-concentration point dragging the regression, or baseline-subtraction settings that were never checked against the raw amplification curves.
Efficiency dropping below 90% more often traces to primer design problems, inhibitors carried over from sample prep, degraded template, or reagents and cycling conditions that were never optimized for this specific target. Checking your inhibitors and modulators panel against your sample matrix is a reasonable first move if inhibition is suspected.
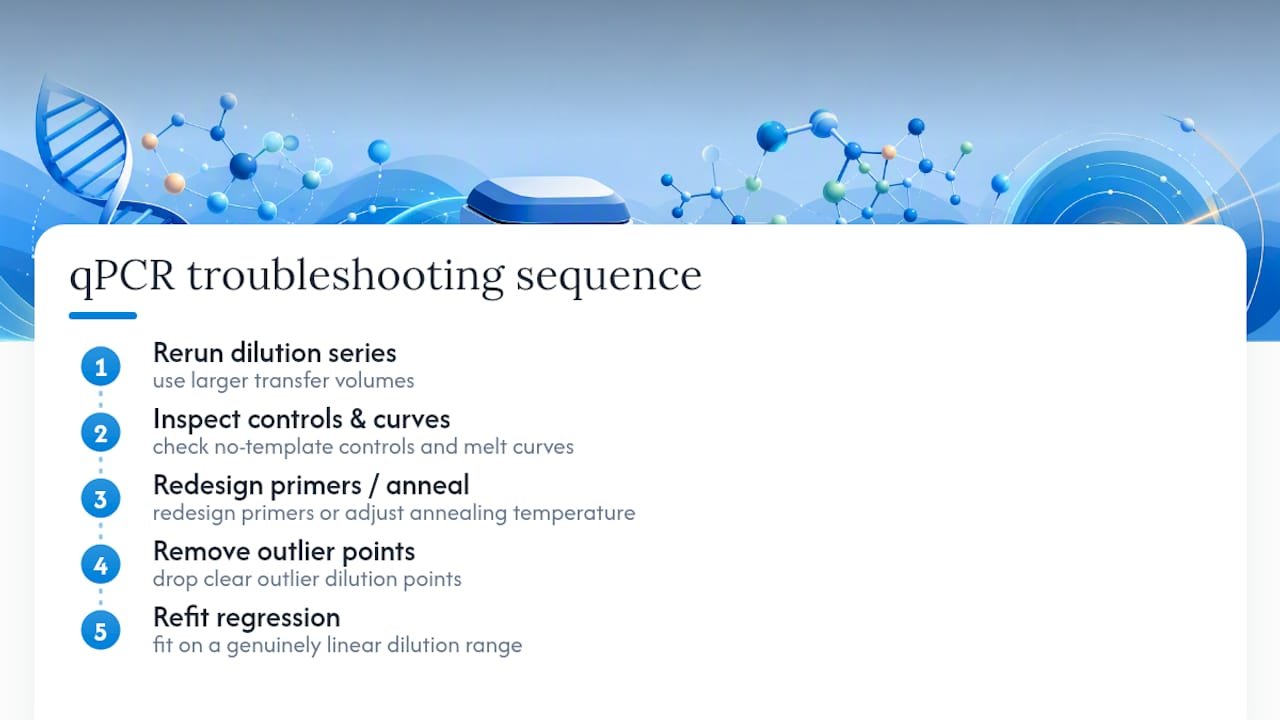
The fix, in most cases, is the same sequence: rerun the dilution series with larger transfer volumes, inspect no-template controls and melt curves for contamination signatures, redesign primers or adjust annealing temperature if amplification kinetics look off, and drop clear outlier dilution points before re-fitting the regression on a genuinely linear range.
Mayflower Bioscience Resources for Reliable qPCR Work
Getting a clean efficiency number depends as much on reagent quality as on math. A qPCR and RT-qPCR product line is available that provides reagents and controls intended for standard-curve work, and the assay setup guide above walks through the practical side of dilution planning.
A short checklist worth keeping next to your bench notebook:
- Dilution plan: five to seven concentrations, 10-fold steps, documented lot numbers.
- Replicates: three to four per concentration, minimum.
- Transfer volumes: 5 microliters or higher wherever the protocol permits.
- Records: slope, R², dynamic range, and instrument ID logged per MIQE.
Questions about matching reagents to a specific target or troubleshooting a stubborn curve can be directed to technical support contact channels.
Why I’d Rather See One Good Curve Than Five Bad Ones
Most efficiency problems I see in published methods sections aren’t math errors. They’re the result of squeezing a two-point “efficiency check” onto a crowded plate and calling it validation. A single, well-powered standard curve, built with enough dilution steps and replicates and documented per MIQE, tells you more than five rushed ones ever will. Precision in this measurement isn’t a formality. It’s the difference between trusting your fold-change and guessing at it. If you’ve got a curve that surprised you, or a fix that worked, that’s worth documenting properly rather than dismissing as noise.
— Alina
Reagents and Support for Building Your Standard Curve
This resource aims to ease the gap between understanding what a good standard curve requires and having the reagents on the bench to build one. Where a lot of labs lose precision is reagent inconsistency between lots, not experimental design.

The other PCR reagents category includes master mixes, enzymes, and controls intended for dilution-series work, aiming to minimize reagent-based variability in slope measurements. It’s one resource among several for implementing these recommendations, not a replacement for good bench technique. If a stubborn efficiency number suggests inhibitors or degraded reagent stock, browsing the inhibitors and modulators offerings or consulting technical support through product pages can be helpful before rebuilding an entire dilution series.
Sources
- Quantification Revisited: What qPCR Efficiency Models Reveal About Data Analysis Integrity
- Efficiency Correction Is Required for Accurate Quantitative PCR Analysis and Reporting
FAQ
What Is the Formula for qPCR Efficiency?
Efficiency equals 10 raised to the power of negative one divided by the slope, minus one: E = 10^(−1/slope) − 1. Multiply by 100 to express it as a percentage.
What Is the Acceptable Range for qPCR Efficiency?
Most labs accept efficiencies between 90% and 110%, provided the standard curve also shows an R² above 0.99 and a genuinely linear dynamic range.
How Do I Calculate ΔΔCq for qPCR?
ΔΔCq is calculated by subtracting the reference-gene ΔCq from the target-gene ΔCq, where each ΔCq is the sample Cq minus a calibrator Cq; however, if target and reference genes have different amplification efficiencies, an efficiency-corrected method like Pfaffl gives a more accurate fold-change than the standard ΔΔCq assumption of perfect doubling.
What Does Efficiency Mean in PCR?
Efficiency describes how closely a reaction doubles its amplicon count every cycle.