
2 Worked Examples to Calculate Spike Recovery, Plus QC Tips
Percent spike recovery is calculated as %R = ((F − I) / A) × 100, where F is the measured concentration of the spiked sample, I is the measured concentration of the unspiked sample, and A is the concentration of analyte actually added, corrected for any dilution. A result near 100% means the assay recovered what you added. Recovery above 100% points to positive bias or matrix enhancement; recovery below 100% points to signal suppression or analyte loss somewhere in the workflow.
TL;DR:
- Recovery above 100% indicates matrix enhancement or positive bias, while below 100% suggests signal suppression or sample loss, requiring interpretation relative to method expectations.
- Accurate calculation of A, reflecting the analyte concentration after dilution, is critical; errors often stem from confusing the stock concentration with the diluted in-sample amount.
- Analyzing multiple spike levels across the assay’s range helps detect recovery drift and ensures reliable performance, especially in ELISA or complex matrices.
- Consistent unit use and proper correction for dilution are essential; mismatches or neglecting dilution factors are common pitfalls that skew recovery results.
Table of Contents
- Spike Recovery Calculation Formula and Worked Examples
- Step-by-Step Spike Recovery Analysis Workflow
- What Counts as Acceptable Spike Recovery
- Common Spike Recovery Calculation Mistakes
- Reagents and Support for Spike Recovery Work
- An Analyst’s Take on Spike Recovery Discipline
- Sources
- FAQ
Spike Recovery Calculation Formula and Worked Examples
The formula itself is simple. Getting A right is where most calculation errors creep in, because A almost never equals the concentration of your spiking solution straight out of the vial. It has to reflect what the analyte concentration would be inside the final spiked sample, after whatever dilution happened when you added it.
The LibreTexts quality assessment reference lays out the same three variables EPA and ASTM methods use: F for the spiked sample result, I for the native (unspiked) result, and A for the added analyte concentration. Keep those labels consistent across your notebook and your LIMS entries. Mixing up “added concentration” with “spike solution concentration” is a common source of bad %R numbers that have nothing to do with the assay itself.
Example 1: Direct spike, no volume change. Say your unspiked sample reads 10 µg/L (I). You spike it with enough concentrated standard to add 20 µg/L (A) without meaningfully changing the sample volume. The spiked sample then reads 28 µg/L (F). Plugging in: %R = ((28 − 10) / 20) × 100 = 90%.
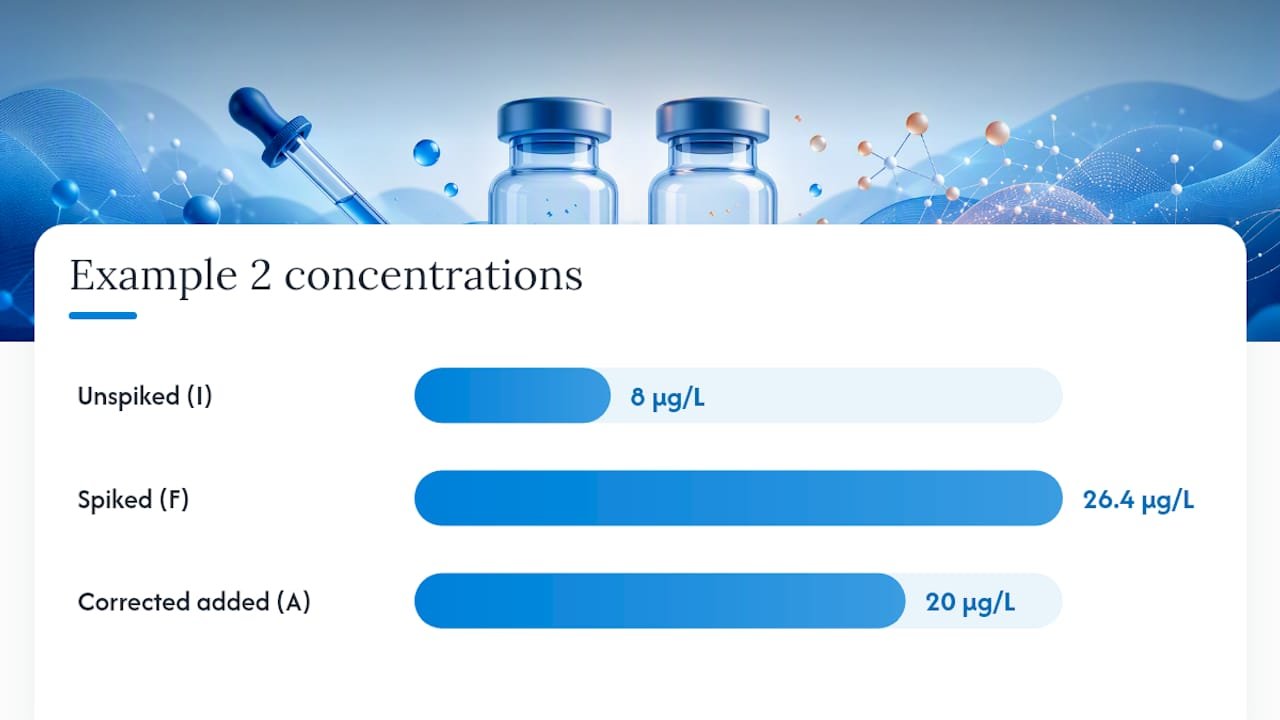
Example 2: Spike with dilution correction. This is where the math gets real. You take 9.0 mL of sample and add 1.0 mL of a 200 µg/L spiking standard, for a final volume (Vf) of 10.0 mL. The spike concentration inside that final volume is not 200 µg/L; it’s 200 × (1.0/10.0) = 20 µg/L. That’s your corrected A. If the unspiked sample (measured before dilution, adjusted to the same basis) reads 8 µg/L and the spiked sample reads 26.4 µg/L, then %R = ((26.4 − 8) / 20) × 100 = 92%.
| Variable | Meaning | Example 2 value |
|---|---|---|
| I | Unspiked sample result | 8 µg/L |
| F | Spiked sample result | 26.4 µg/L |
| A (uncorrected) | Spike standard concentration | 200 µg/L |
| A (corrected) | A × (spike volume / final volume) | 20 µg/L |
| %R | ((F−I)/A) × 100 | 92% |
Before trusting any of these numbers, run through a short conversion checklist: confirm F and I share the same units as A, confirm A was calculated from final volume (not sample volume alone), and confirm you didn’t accidentally use the spike solution’s stock concentration instead of its diluted, in-sample value. An online recovery calculator is a decent sanity check on the arithmetic once you’ve done the dilution math by hand.
Step-by-Step Spike Recovery Analysis Workflow
A repeatable procedure keeps spike recovery analysis from becoming a source of its own errors. Here’s the sequence that holds up across chemistry and immunoassay work alike:
- Pick your spike level. Spike at 1 to 10 times the expected analyte concentration, or 5 to 50 times the method detection limit, whichever produces the larger number, per LibreTexts’ quality assessment guidance. Too low a spike gets lost in assay noise; too high can push the reading outside the assay’s linear range.
- Run matched replicates. Analyze the unspiked sample and the spiked sample in duplicate or triplicate under identical conditions, ideally in the same run.
- Measure F and I directly from the assay output, using the same units and dilution basis for both.
- Calculate A by accounting for every volume added during spiking, not just the concentration of the stock standard.
- Apply the %R formula and record the result alongside the raw F, I, and A values, not just the final percentage.
- Flag anything outside your acceptance window for review before it goes into a final report.
For ELISA-based work specifically, guidance from ImmunoChem Insights on spike-and-recovery validation recommends running 3 to 4 spike levels across the assay’s working range rather than a single level, since recovery can drift at the low and high ends even when it looks fine in the middle.
Pro Tip: Log A, F, and I as separate fields in your LIMS or spreadsheet template, not just the final %R. When a recovery fails months later, you’ll want to know whether the problem was the calculation or the measurement, and you can’t reconstruct that from a percentage alone.
What Counts as Acceptable Spike Recovery
Many labs consider spike recovery values close to 100% as acceptable, though acceptable recovery ranges vary depending on the method, matrix, and regulatory framework governing the assay.
The distinction that trips people up is matrix spike (MS/MSD) versus laboratory control sample (LCS). EPA’s quality assurance guidance treats these as complementary, not interchangeable: an LCS spikes a clean, matrix-free reference to check whether the analytical system itself is performing correctly, while an MS/MSD spikes the actual sample matrix to check whether that specific matrix is interfering with recovery.
- If the LCS passes but the MS/MSD fails, suspect a matrix effect specific to that sample.
- If both fail, suspect a laboratory or method-wide problem.
- If the MS and MSD (duplicate matrix spikes) disagree sharply with each other, suspect precision issues in sample handling rather than a systematic bias.
ASTM’s D5810 guidance adds an important caution here: don’t use a low or high spike recovery to mathematically correct the reported result for that sample. A spiked standard doesn’t always bind, partition, or behave exactly like the native analyte, so a correction factor derived from it can introduce more error than it removes. When recovery is consistently poor, consider dilution, an internal standard, or the method of standard additions instead of a post hoc fudge factor.
Common Spike Recovery Calculation Mistakes
Most bad %R numbers trace back to one of a handful of repeatable errors, and most of them are cheap to catch before you report anything.
- Unit mismatches. F, I, and A must share units before you subtract or divide. A mismatch between µg/L and mg/L is an easy way to get a 90% recovery that’s actually 9% or 900%.
- Skipping the dilution correction on A. Using the spiking standard’s stock concentration instead of its diluted, in-sample concentration is probably the single most common error in this whole calculation.
- Forgetting to subtract I. Some analysts compute F/A instead of (F − I)/A, which inflates recovery whenever there’s meaningful endogenous analyte in the sample.
- Not distinguishing field spikes from lab spikes. If a field spike fails but an identical laboratory spike passes, the problem likely happened during sampling, storage, or transport, not in the assay itself.
When both field and lab spikes fail together, that’s the signal to stop troubleshooting the math and start suspecting a real matrix interference, at which point the method of standard additions is often the more reliable path forward.
Reagents and Support for Spike Recovery Work
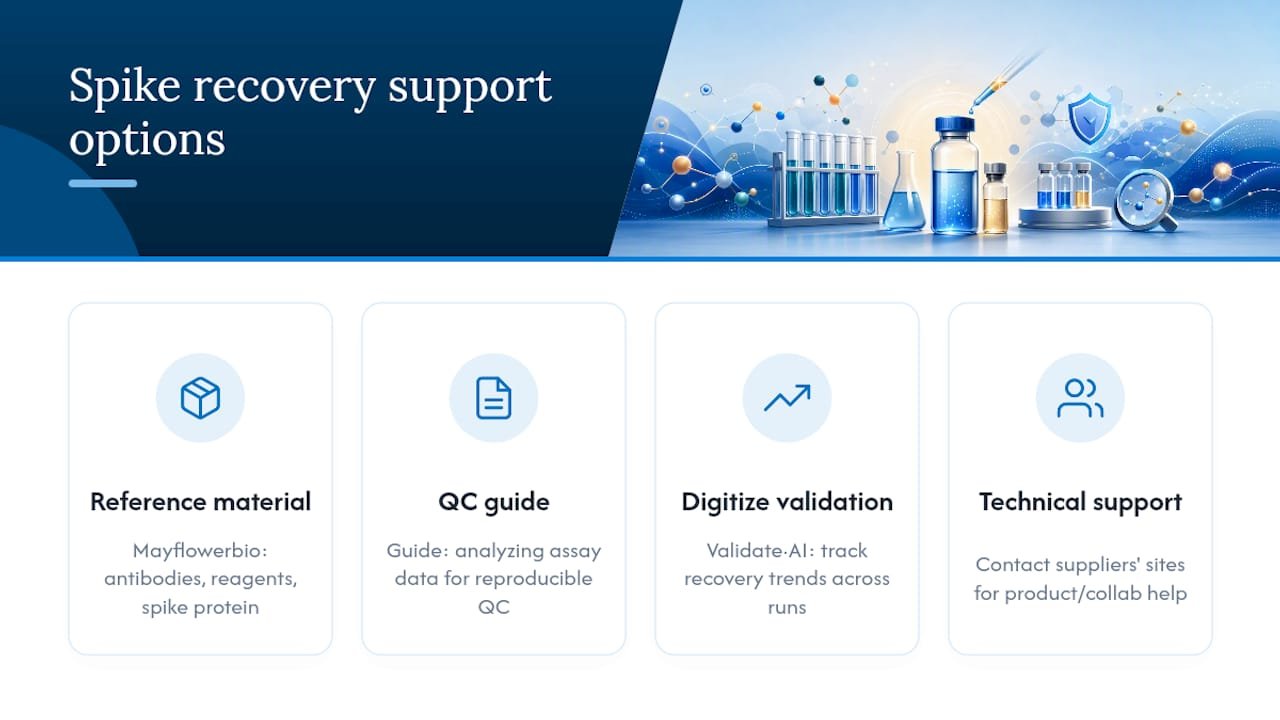
Getting clean, reproducible spike recovery numbers starts with reliable reference material and controls, not just a correct formula. Mayflowerbio supplies antibodies, bioassay reagents, and spike protein reference material that labs use to build spiked controls for assay validation and QC work. If your assay data handling itself needs a second look, our guide on analyzing assay data for reproducible results covers the QC steps that pair naturally with spike recovery tracking.
Teams running higher volumes of validation work sometimes turn to platforms like Validate·AI from Qualitum to digitize validation evidence and track recovery trends across runs instead of managing them in scattered spreadsheets.
If your lab needs assay development support, bioassay reagents, or help troubleshooting a method that keeps returning poor recovery numbers, Technical support teams can be contacted through the respective supplier’s site for product and collaboration inquiries.
An Analyst’s Take on Spike Recovery Discipline
Spike recovery is a diagnostic, not a correction factor. The number one habit worth building is documentation: write down F, I, and A separately, every time, even when the final percentage looks fine. The recoveries that get labs into trouble are rarely the obvious failures. They’re the borderline ones nobody wrote down clearly enough to investigate three months later.
Use it to decide whether to dilute, add an internal standard, or switch to standard additions, not to multiply your final answer by a fudge factor.
— Alina
Sources
- 15.3: Quality Assessment – Chemistry LibreTexts
- Quality Assurance (QA) – Quality Control (QC) | US EPA
- D5810 Standard Guide for Spiking into Aqueous Samples
FAQ
What Is the Formula for Calculating Spike Recovery?
The canonical formula is %R = ((F − I) / A) × 100, where F is the spiked sample result, I is the unspiked sample result, and A is the spike concentration corrected for dilution.
How Is the Recovery Rate Calculated When Dilution Is Involved?
Calculate A using the volume ratio of spike added to final volume (for example, spiking 1.0 mL into a 10.0 mL final volume divides the stock concentration by 10), then apply the same %R formula using that corrected A value.
Should I Use Spike Recovery to Correct My Final Results?
No. ASTM guidance cautions against mathematically correcting raw results with spike recovery data, since a spiked standard may not behave exactly like the native analyte in that matrix.
What’s the Difference Between a Matrix Spike and a Laboratory Control Sample?
A matrix spike (MS/MSD) tests recovery within the actual sample matrix, while a laboratory control sample (LCS) tests recovery in a clean, matrix-free reference, and EPA guidance recommends using both together to separate matrix effects from lab performance.