
Stop Misleading qPCR Results Without New Equipment: Ct vs Cq for Labs
Ct and Cq measure the exact same thing: the cycle number at which fluorescence in a qPCR reaction crosses a detection threshold. The MIQE guidelines recommend “Cq” as the standardized, instrument-neutral term, replacing platform-specific labels like Ct, Cp, or TOP. The immediate action for any lab: pick one term, use it consistently in every report, and document the threshold, baseline, and software version behind every value.
TL;DR:
- Cq and Ct values are influenced by technical factors like amplification efficiency, threshold setting, and instrument variability, making raw numbers not directly comparable across labs.
- Proper standardization requires measuring efficiency with a standard curve, reporting calibration data, and converting Cq to absolute quantities rather than relying on relative fold changes.
- Values above 38 Cq are often unreliable and should be confirmed with repeat testing and controls, especially when near the assay’s detection limit.
- Using efficiency-corrected methods like the Pfaffl method or calibration curves reduces bias and improves reproducibility over simple ΔCq or ΔΔCq calculations.
- Documenting analysis parameters, assay conditions, and quality controls in every report is essential to ensure transparency and reproducibility in qPCR results.
Table of Contents
- Ct vs Cq: What the Number Actually Represents
- Ct, Cq, Cp, TOP: Why the Terminology Split and What MIQE Recommends
- What Changes a Cq Value: Efficiency, Threshold, and Instrument Differences
- Why Raw Cq, ΔCq, and ΔΔCq Numbers Can Mislead You
- Reading Cq Values: When a Result Is Solid, Borderline, or Unreliable
- Common Cq Reporting Mistakes That Undermine Reproducibility
- Mayflowerbio Resources for MIQE-Aligned qPCR Workflows
- A Working Lab’s Take on Cq-First Reporting
- How Mayflowerbio Supports Efficiency-Corrected qPCR
- Key Guidelines and Reviews to Consult Directly
- Sources
- FAQ
Ct vs Cq: What the Number Actually Represents
Every qPCR run produces an amplification curve: a plot of fluorescence against cycle number that starts flat, rises exponentially, then plateaus. Ct and Cq both name the cycle where that curve crosses a set fluorescence threshold, distinguishing real signal from background noise. Below that threshold, the machine cannot reliably tell amplification from baseline fluctuation. Above it, you are watching the reaction run out of reagents.
The relationship between this number and your starting material runs backward from what most new users expect. A lower Cq means more starting template, because a sample loaded with target sequence needs fewer amplification cycles to generate detectable fluorescence. A high Cq means the assay had to work harder, doubling the product many more times before crossing threshold, which points to a low starting copy number, or a failing reaction. Each cycle in the exponential phase represents a doubling, so a difference of one Cq unit corresponds to roughly a twofold difference in target quantity, assuming near perfect amplification efficiency.
Labs commonly use rough orientation bands to interpret raw values, though these ranges are not universal biological law:
- Cq below 29: target is abundant, usually detected with confidence
- Cq between 29 and 37: moderate signal, generally interpretable but worth flagging for QC review
- Cq above 38: often unreliable, close to the limit of detection, and prone to false positives from primer dimers or contamination
These cutoffs depend entirely on assay design, instrument sensitivity, and validation data specific to that assay. A diagnostic test built to detect a low-abundance pathogen might define “abundant” very differently than a gene expression assay running on abundant housekeeping transcripts. Treat published ranges as a starting orientation, not a fixed rule you can import into a new assay without checking it against your own standard curve.
Ct, Cq, Cp, TOP: Why the Terminology Split and What MIQE Recommends
The alphabet soup of qPCR terminology exists because instrument manufacturers built proprietary software long before anyone tried to standardize reporting. Applied Biosystems platforms popularized “Ct” (threshold cycle). Roche instruments used “Cp” (crossing point). Other systems introduced “TOP” (take-off point) and various derivatives. Each term describes essentially the same cycle-crossing event, calculated with slightly different algorithms for baseline subtraction and threshold placement.
That fragmentation created a real problem for anyone trying to compare results across labs, publications, or instruments. A manufacturer glossary from QIAGEN confirms that Ct, Cq, and Cp are treated as functionally equivalent terms, and recommends adjusting threshold and baseline settings on a per-probe basis rather than relying on default software values across every assay.
The Real-time PCR Data Markup Language (RDML) initiative and the MIQE guidelines pushed back on this fragmentation directly. MIQE recommends “Cq” specifically because:
- It carries no vendor attachment, so a paper or report reads the same regardless of which platform generated the data
- It reinforces that the value represents a quantification cycle, not merely a detection threshold, which matters when the number feeds into downstream calculations
- It supports data exchange between labs and software packages that follow RDML formatting, reducing translation errors when results move between systems
For a working lab, the practical fix is a short naming policy. Document which field in your instrument software maps to “Cq” for reporting purposes, note the exact threshold and baseline method the software used to generate it, and apply that mapping consistently across every export, spreadsheet, and manuscript draft. That single step prevents the confusion that shows up when a technician exports “Ct” from one machine and “Cp” from another, then tries to merge the numbers into one table without realizing they were calculated with different baseline algorithms.
What Changes a Cq Value: Efficiency, Threshold, and Instrument Differences
A Cq value is not a fixed physical constant. It shifts based on a stack of technical decisions made before, during, and after the PCR run, and ignoring any of them turns a quantitative result into a guess.
-
PCR efficiency. Ideal amplification doubles the product every cycle, a 100% efficiency rate. Real reactions rarely hit that exactly, and efficiency below roughly 90% or above 110% distorts the relationship between Cq and starting quantity in ways that a raw comparison cannot detect. Efficiency depends on primer design, amplicon length, and reaction chemistry, and it must be measured per assay using a standard curve, not assumed.
-
Threshold placement. Where the software draws the threshold line directly determines the Cq value it reports. Set the threshold too low, in the noisy background region, and you get artificially early, inconsistent crossings. Set it too high, and you lose sensitivity for low-abundance targets. Different software packages default to different threshold algorithms, which is part of why raw Cq values from two platforms are not automatically comparable.
-
Baseline correction. Software subtracts background fluorescence from early cycles to establish a flat baseline before calculating threshold crossing. Baseline algorithms vary by manufacturer, and a poorly chosen baseline window shifts every downstream Cq value in a sample-dependent way.
-
Sample matrix and inhibitors. Blood, soil, plant tissue, and clinical swabs all carry co-extracted compounds that inhibit polymerase activity to different degrees. Inhibition raises Cq independent of true target abundance, which is exactly the kind of variable a raw Cq comparison cannot separate from a genuine biological difference.
-
Reagents and mastermix chemistry. Different polymerase formulations, dNTP concentrations, and buffer systems all shift amplification kinetics. Swapping master mix lots or brands mid-study without re-validating efficiency is a common, avoidable source of Cq drift.
-
Instrument and inter-run variability. Thermal uniformity across a plate, detector sensitivity, and even how well a plate seals against evaporation contribute to run-to-run and machine-to-machine differences in absolute Cq values.
Pro Tip: Run a standard curve every time you introduce a new lot of reagents, a new primer batch, or switch instruments; efficiency can drift silently between runs even when everything else in the protocol looks unchanged.
Because of this stack of variables, a raw Cq value from one lab is not inherently comparable to a raw Cq value from another lab, even for the same target. That is the entire argument behind reporting efficiency and calibration data alongside every Cq, not instead of it.
Why Raw Cq, ΔCq, and ΔΔCq Numbers Can Mislead You
The ΔΔCq method for relative quantification is popular because it is fast: subtract a reference gene’s Cq from your target’s Cq to get ΔCq, then subtract a control sample’s ΔCq from your experimental sample’s ΔCq to get ΔΔCq, then raise 2 to the negative power of that number to estimate fold change. That final step, the 2^(−ΔΔCq) calculation, quietly assumes both the target and reference genes amplify at exactly 100% efficiency, doubling perfectly every single cycle.
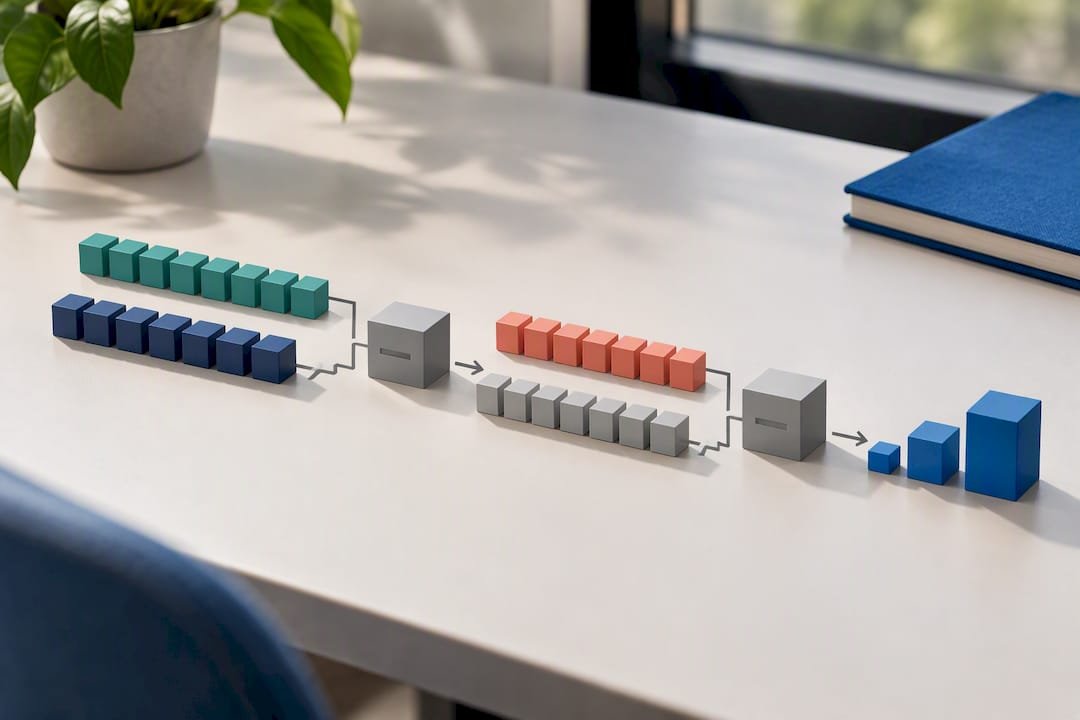
Real assays rarely meet that assumption. When the target and reference primers have different efficiencies, even by a few percentage points, the ΔΔCq fold-change estimate becomes systematically biased, sometimes by a wide enough margin to change a study’s conclusion. The Ruijter et al. review documents this exact failure mode across published qPCR literature, noting that treating Cq as a direct, efficiency-free measure introduces reproducibility problems that ripple through downstream statistical analysis.
There are two established fixes, and neither requires exotic equipment:
- Pfaffl method. This approach explicitly incorporates the measured amplification efficiency of both target and reference genes into the fold-change calculation, correcting for the mismatch that breaks the standard ΔΔCq assumption.
- Absolute quantification with calibration curves. Running a dilution series of known-concentration standards alongside your samples lets you convert Cq directly into copy number or concentration, sidestepping the relative-comparison assumptions entirely.
Clinical Chemistry’s reporting guidance recommends converting Cq to efficiency-corrected target quantities and reporting standard-curve slope, intercept, and prediction intervals rather than presenting raw Cq or fold-change numbers on their own.
A practical checklist for producing efficiency-corrected quantities:
- Run a dilution series (typically five to seven points spanning your expected concentration range) to generate a standard curve for each target and each reference gene.
- Calculate efficiency from the curve’s slope; a slope near negative 3.32 corresponds to close to 100% efficiency.
- Apply Pfaffl correction or convert Cq to absolute quantity using the calibration curve, rather than defaulting to raw 2^(−ΔΔCq).
- Report the efficiency value, the R² of the standard curve, and the prediction interval alongside every quantitative claim.
Never average raw Cq values across replicates before converting to quantity. Cq is logarithmically related to starting copy number, so arithmetic mean and standard deviation on the Cq scale distort the underlying linear-scale variability in ways that skew statistical tests downstream.
Reading Cq Values: When a Result Is Solid, Borderline, or Unreliable
The orientation bands mentioned earlier (roughly under 29, between 29 and 37, and above 38) give a quick gut check, but they only mean something once they are tied to your assay’s own validation data. A Cq of 36 might be a perfectly solid positive call for one pathogen assay validated down to that range, and a coin flip for another assay whose limit of detection sits at Cq 32.
For samples that land in the moderate-to-borderline zone, a short list of QC actions separates a real signal from an artifact:
- Repeat the run. A single borderline replicate is not a result; run in triplicate at minimum and check for consistency.
- Check the no-template control (NTC). If your NTC also shows late amplification, you likely have contamination or primer dimer artifacts, not true target signal.
- Run a melt curve or probe check. For SYBR-based assays, an unexpected melt peak shape flags nonspecific amplification. For probe-based assays, confirm the probe chemistry performed as expected.
- Sequence the product when in doubt. For high-stakes diagnostic or publication-bound results, sequencing confirmation on an ambiguous amplicon settles the question definitively.
Beyond individual sample QC, the assay itself needs its limit of detection (LOD) and lower limit of quantification (LLOQ) established through dedicated dilution experiments, not inferred from a generic Cq cutoff borrowed from another lab’s protocol. Report the LOD as the lowest concentration reliably detected across replicate runs, and pair any quantity estimate with the prediction interval generated from your calibration curve, following the reporting approach Clin Chem’s standard-curve guidance lays out for calculating per-curve amplification efficiency and its variance. For diagnostic workflows specifically, a validated quantification threshold with documented QC tends to produce more defensible positive and negative calls than an arbitrary Cq cutoff pulled from a different assay’s literature.
Common Cq Reporting Mistakes That Undermine Reproducibility
Three mistakes show up repeatedly in published qPCR work, and all three are avoidable with a short procedural fix.
- Averaging raw Cq values across replicates or conditions. Because Cq sits on a logarithmic scale relative to quantity, arithmetic averaging distorts the true linear-scale variability. Convert each Cq to quantity first, then average the quantities.
- Assuming 100% amplification efficiency without measuring it. Every ΔΔCq calculation implicitly assumes equal, near-perfect efficiency for target and reference. Measure it with a standard curve instead of assuming it, especially when comparing across primer sets or sample types.
- Applying a Cq cutoff without validating it against LOD and LLOQ data. A cutoff copied from another paper’s supplementary methods was validated for that paper’s specific assay conditions, not yours. Run your own dilution series before adopting a numeric threshold as diagnostic or publication-ready.
Pro Tip: Before submitting a manuscript or diagnostic validation report, export the raw fluorescence data alongside your calculated Cq values. Reviewers and downstream labs increasingly ask for the underlying curves, not just the summary number.
The Ruijter et al. review found that a substantial share of published qPCR studies still report raw Cq or ΔΔCq figures without checking or disclosing PCR efficiency, a gap that has likely contributed to broader reproducibility concerns across the field. Closing that gap does not require new equipment, only a documented efficiency check before the data goes into a table.
Mayflowerbio Resources for MIQE-Aligned qPCR Workflows
Producing efficiency-corrected, MIQE-compliant results starts with reagents that behave consistently run after run. Mayflowerbio’s qPCR and RT-qPCR resources cover assay design and protocol guidance built around the same reporting principles MIQE recommends: consistent thresholds, documented baselines, and calibration data that back up every quantity you report. The molecular assay setup guide walks through SOP-level detail on reagent handling and QC checkpoints that reduce the inter-run variability discussed above.
For labs running standard curves as part of routine validation, working with a reliable mastermix like the HOT FIREPol SolisGreen qPCR Mix 2.0 removes one common source of efficiency drift between reagent lots.
This article was written by Alina, drawing on published MIQE guidance and peer-reviewed qPCR methodology literature to translate standardization recommendations into practical lab steps.
A Working Lab’s Take on Cq-First Reporting
Adopting “Cq” as your lab’s standard label is the easy part. The harder discipline is building the habit of recording analysis settings every single time, not just when someone asks. I’d push any lab to write a one-page policy: Cq is the label, every export includes threshold and baseline method, and every assay gets its efficiency checked before results go into a report, not after a reviewer flags it.
Build your SOP around a standing schedule for standard curves, strict rules for what counts as a valid no-template control, and a reporting template with fields for efficiency, LOD, and dynamic range built in from the start, not bolted on later. Export raw fluorescence data and software version metadata as a matter of routine. It costs a few extra minutes per run and saves the far more expensive problem of a result nobody can reproduce six months later, including you.
— Alina
How Mayflowerbio Supports Efficiency-Corrected qPCR
This resource supports labs that want to standardize on Cq without rebuilding their whole workflow to do it. The other PCR reagents category covers mixes formulated for consistent amplification efficiency across runs, which is the exact input that makes efficiency-corrected reporting practical rather than theoretical.

If your lab is validating a new assay or troubleshooting inconsistent Cq values between instruments, Technical support teams can walk through calibration curve design and reagent selection for your specific target. For labs that need functional assay data beyond amplification chemistry, the bioassay services page covers testing options, including ion channel and patch clamp services, that support broader validation work alongside your qPCR pipeline. Reach out through the product pages to request technical documentation or discuss validation data for your specific application before your next assay run.
Key Guidelines and Reviews to Consult Directly
Standardizing your lab’s Cq reporting gets easier once the primary documents are on hand rather than summarized secondhand.
- MIQE guidelines. The foundational checklist for what to report in any quantitative PCR publication, including efficiency, calibration, and analysis settings. Read it directly via the MIQE Guidelines PDF.
- Use and misuse of Cq (Ruijter et al.). A peer-reviewed breakdown of how Cq gets misapplied in practice, with concrete recommendations for efficiency-corrected analysis. Available at PMC.
- Clinical Chemistry reporting guidance. Covers efficiency-corrected quantification methods and standard-curve reporting standards for diagnostic and research contexts, available through Clinical Chemistry.
For labs handling regulatory submissions where documentation scrutiny extends beyond the bench, translation and technical documentation review practices used in clinical evaluation reports offer a useful parallel for how much reporting detail notified bodies now expect.
This article is general information, not a substitute for advice from a qualified doctor. Consult a qualified healthcare professional about your own circumstances before acting on anything here.
Sources
- Use and misuse of Cq in qPCR data analysis and reporting (Ruijter et al.)
- Clinical Chemistry article on qPCR reporting (efficiency-corrected recommendations)
- qPCR analysis: From Cq values to reliable results (BitesizeBio)
FAQ
What Ct value is too high to trust?
A Cq or Ct above roughly 38 is often considered unreliable, close to the assay’s detection limit where primer dimers and background noise can produce false positives. The exact cutoff depends on your specific assay’s validated limit of detection, not a universal number, so confirm any borderline result with a repeat run and a no-template control check.
What is Cq in qPCR?
Cq stands for quantification cycle, the cycle number at which fluorescence crosses a set detection threshold during amplification. MIQE recommends it as the standardized term to replace instrument-specific labels like Ct or Cp, since all three describe the same measurement.
Is qPCR more accurate than standard PCR?
qPCR provides quantitative data in real time, tracking amplification cycle by cycle, while standard PCR only shows an endpoint result on a gel. That real-time tracking, paired with a properly calibrated standard curve, gives qPCR a meaningful accuracy advantage for measuring actual target quantity rather than simply confirming presence or absence.
What does Ct mean for PCR results?
Ct, or threshold cycle, marks the cycle where amplified product first generates detectable fluorescence above background. A lower Ct signals more starting template in the sample, while a higher Ct signals less, though the exact relationship depends on the assay’s measured amplification efficiency rather than a fixed universal formula.