
Nearly One in Five Curves Shift: 4PL vs 5PL and FDA M10 for ELISAs
Use a four-parameter logistic (4PL) model for symmetrical assay standard curves, and reserve the five-parameter logistic (5PL) for cases where reproducible asymmetry changes back-calculated concentrations enough to matter. Either choice needs documented justification under FDA M10 guidance, with enough calibrators and validation runs to support it. For labs sourcing reagents or assay support during that validation work, analytical models and tools for clinical-trial data offer valuable external perspectives alongside products and technical guidance.
TL;DR:
- Using a 4PL model is appropriate when the dose-response curve appears symmetrical and residuals are evenly distributed near both asymptotes.
- A 5PL model should only be used if visual inspection and residual analysis reveal consistent, reproducible asymmetry that significantly impacts back-calculated concentrations.
- Reproducibility across independent validation runs is critical; asymmetry that varies between runs indicates noise, not a true assay characteristic.
- Overfitting risks increase with 5PL when cal calibrators are sparse or noisy, especially if the asymmetry parameter fluctuates between runs.
- Documentation must justify the chosen model, including calibrator design, fitting comparison statistics, and evidence of reproducibility, aligning with FDA M10 guidance.
Table of Contents
- 4PL vs 5PL: What the Extra Parameter Actually Changes
- When to Pick 4PL vs 5PL in Practice
- Validation Pitfalls: Weighting, Overfitting, and Reproducibility
- Step-by-Step: Deciding, Fitting, and Documenting the Model
- Our Take: Default to Simplicity, Prove the Exception
- How Mayflowerbio Supports Your Assay Validation Work
- FAQ
- Sources
4PL vs 5PL: What the Extra Parameter Actually Changes
Both models describe a sigmoidal dose-response relationship: a lower asymptote, an upper asymptote, a slope, and an inflection point (EC50). The 4PL assumes this curve is symmetrical around the inflection point. The 5PL adds a fifth term, an asymmetry factor, that lets the curve approach its two asymptotes at different rates. According to the Bio-Rad technical note on curve fitting, this factor modifies how the response curve bends as it nears the top and bottom plateaus, rather than changing the basic sigmoidal shape.
That distinction matters most at the curve’s extremes, where assays do their real analytical work:
- EC50 estimates can shift meaningfully once asymmetry is introduced, since the inflection point is no longer the curve’s midpoint.
- Residuals near the lower and upper asymptotes often shrink with a 5PL fit, which is exactly where 4PL tends to struggle.
- Back-calculated concentrations near the lower limit of quantification (LLOQ) are the most sensitive to which model is used.
A peer-reviewed evaluation of asymmetric curve fitting found that switching to an asymmetric fit changed the interpretation in a significant minority of mixture toxicity curves, indicating that nearly one in five curves could be read differently depending on model choice. That is not a rounding difference. It means nearly one in five curves in that dataset would have been read differently depending on which model a lab chose, with the effect concentrated where asymmetry was most pronounced, typically the lower portion of the curve.
When to Pick 4PL vs 5PL in Practice
Deciding between models should not be a coin flip or a default software setting. Run through this checklist on the plate, before committing to a model:
- Plot raw responses against log concentration and look for visible skew toward one asymptote; symmetrical curves rarely need a fifth parameter.
- Compare residual plots for both fits; a 4PL with residuals clustered near the asymptotes while the mid-range fits well is a classic asymmetry signature.
- Check sum-of-squares residuals (SS-Res) and AIC between the two models; a marginal statistical improvement in a 5PL rarely justifies the added complexity.
- Confirm reproducibility across independent runs, not just one plate; asymmetry that appears once and disappears on repeat runs is noise, not signal.
- Verify you have at least six non-zero calibrators plus blanks, with anchor points added only to help define asymptotes, never counted toward acceptance.
The operational rule is simple: pick the simplest model that meets your pre-specified acceptance criteria, and write down why. A 5PL that fits marginally better on one run but can’t reproduce that fit on the next is a liability during validation, not an asset.
Pro Tip: Fit both models with identical weighting before comparing them; differences driven by weighting changes, not the extra parameter, are a common source of false asymmetry calls.
Validation Pitfalls: Weighting, Overfitting, and Reproducibility
Choosing a model is only half the job. Making it survive method validation is the other half, and this is where most curve-fitting decisions fall apart.
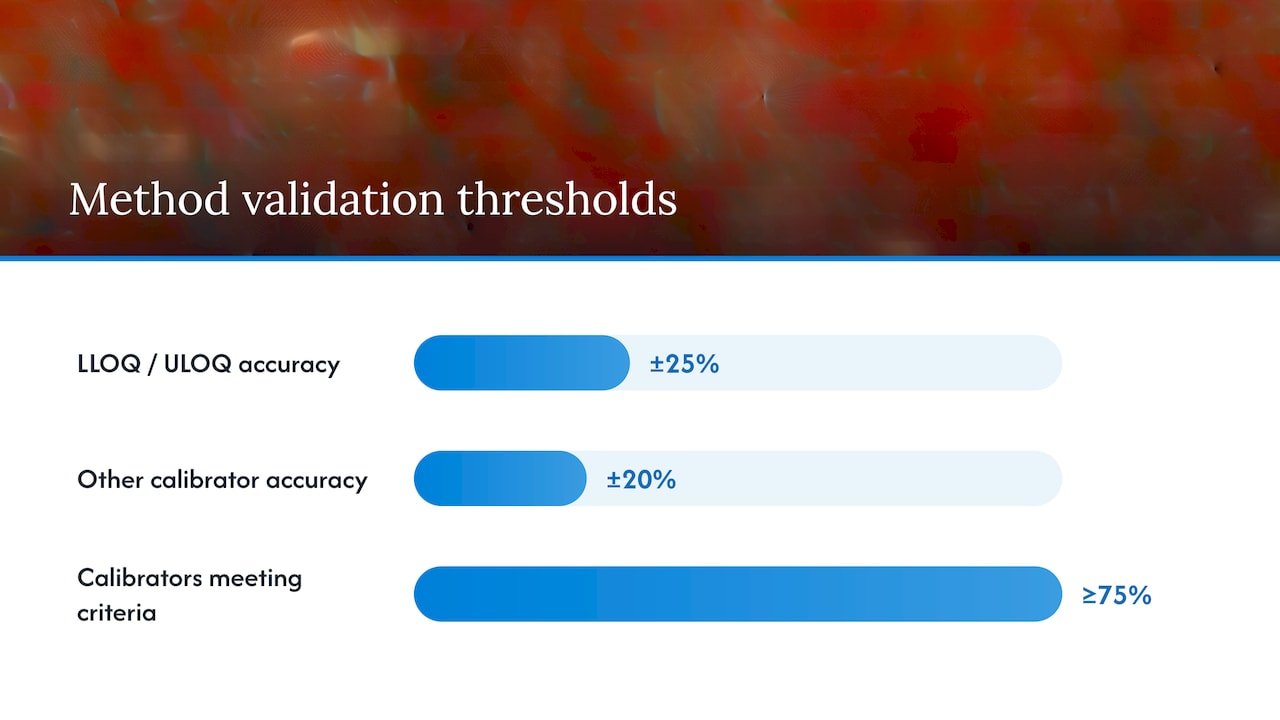
FDA’s M10 guidance specifies that calibration curves for ligand-binding assays need at least six non-zero calibrator levels spanning the LLOQ to the upper limit of quantification (ULOQ), with back-calculated concentrations meeting ±25% accuracy at the LLOQ/ULOQ and ±20% elsewhere, and at least 75% of calibrators meeting those criteria. The FDA’s bioanalytical method validation guidance reinforces this by recommending the simplest model that adequately describes the response relationship, with any deviation from that default requiring its own justification.
Two failure modes show up repeatedly:
- Overfitting with 5PL. When standards are sparse or noisy, the asymmetry parameter can become unconstrained, producing a curve that fits the observed points well but extrapolates to unrealistic asymptotes outside the standard range.
- Anchor point misuse. Anchor points can help define asymptote behavior, but FDA M10 excludes them from run acceptance calculations; treating them as regular calibrators inflates apparent performance.
One documented mitigation is appropriate weighting, such as 1/y or 1/y², which stabilizes variance at low response levels and can determine whether a model passes acceptance criteria at all. Pair that with higher calibrator density near the LLOQ, and test parameter stability across several independent validation runs before locking in a 5PL. An asymmetry term that moves around from run to run is a sign to fix assay conditions, not to force a more complex model onto unstable data.
Step-by-Step: Deciding, Fitting, and Documenting the Model
A repeatable workflow keeps this decision consistent across analysts and assays:
- Prepare calibrators. Use at least six non-zero concentrations plus blanks, spanning the intended LLOQ to ULOQ, with anchor points added separately if needed.
- Inspect visually. Plot raw signal against log concentration and look for asymmetric curvature before running any statistics.
- Fit both models. Run 4PL and 5PL with identical weighting, then compare SS-Res, AIC, and back-calculated %RE at each calibrator level.
- Test reproducibility. Repeat across independent runs; a model whose fit statistics or asymmetry parameter shift run to run has not earned its place in the validated method.
- Document the choice. Record software, algorithm, weighting scheme, and convergence criteria, along with the rationale for the final model.
Your validation report should capture the calibrator design, weighting scheme, model comparison statistics, QC back-calculation results across runs, and the specific software package and version used, since optimization and convergence behavior differ between packages. For a deeper look at the broader analysis pipeline around these decisions, our guide to analyzing assay data for reproducible results covers the steps that come before and after curve fitting.
Our Take: Default to Simplicity, Prove the Exception
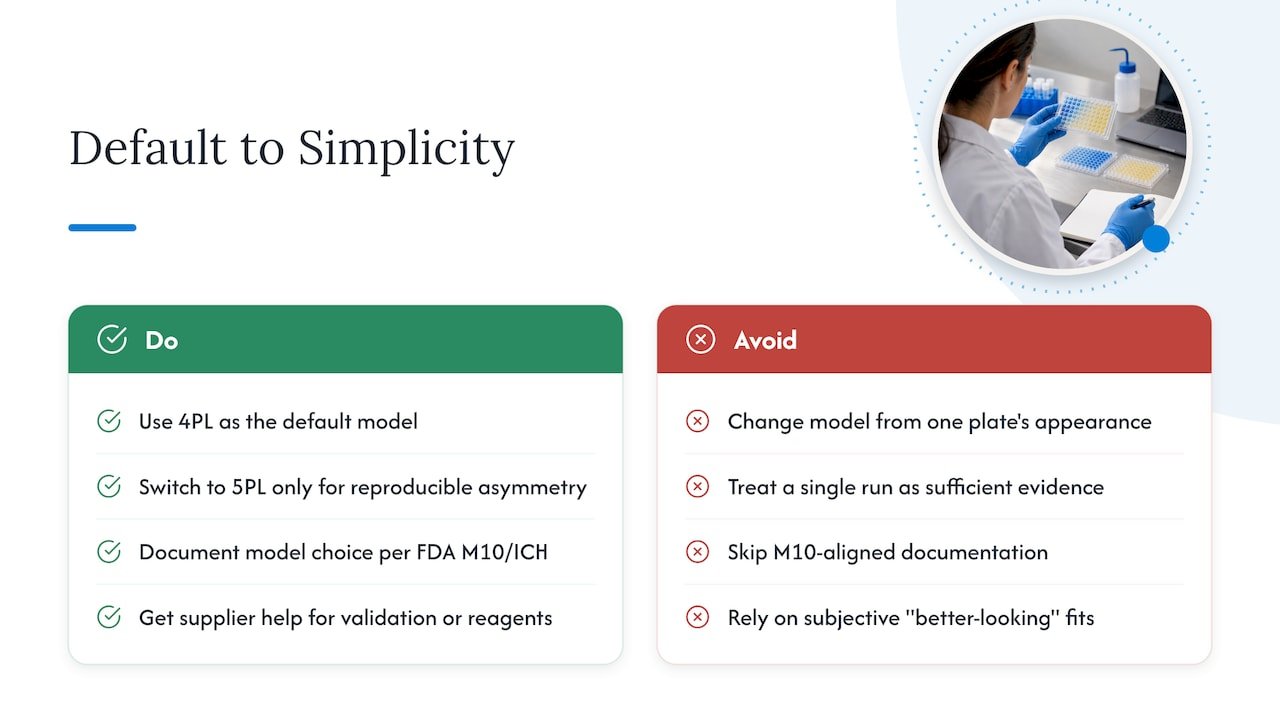
We default to 4PL and move to 5PL only when asymmetry shows up on repeat runs and changes a result that matters, like a QC sample near the LLOQ. A better-looking fit on one plate is not evidence; reproducible asymmetry across independent runs is. That distinction is what separates a defensible method validation package from one that gets flagged during review.
Keeping documentation aligned with FDA M10 and the broader ICH framework protects you later, when a reviewer asks why you chose one model over the other. Labs that need reagent support or help validating a curve-fitting approach can find both through an appropriate supplier.
— Alina
How Mayflowerbio Supports Your Assay Validation Work
Choosing the right model only works if the underlying assay reagents are solid. We supply the bioassays and multiplex assay kits that generate the standard curves researchers are modeling, including AimPlex multiplex assay panels built for the kind of ligand-binding work covered here.

Our offerings include:
- Antibodies and immunoassay reagents sourced for ELISA and multiplex panel development.
- Ion channel testing and patch clamp services for labs needing assay support beyond reagents.
- Karyotype analysis services for cell biology validation work alongside your assay program.
Browse our full product catalog or reach out about your next validation project.
This article is general information, not a substitute for advice from a qualified doctor. Consult a qualified healthcare professional about your own circumstances before acting on anything here.
FAQ
What is the main difference between 4PL and 5PL models?
The 4PL assumes a symmetrical sigmoidal curve around its inflection point, while the 5PL adds an asymmetry parameter that lets the curve approach its two asymptotes at different rates, as described in the Bio-Rad technical note. Choose 5PL only when that asymmetry is reproducible and affects back-calculated results.
How many calibrators does FDA guidance require for a standard curve?
FDA M10 guidance calls for at least six non-zero calibrator levels spanning the LLOQ to ULOQ, with at least 75% of calibrators meeting the specified accuracy criteria. Anchor points can help define curve asymptotes but are excluded from acceptance calculations.
Can using a 5PL model cause overfitting in immunoassay data?
Yes, when calibrator density is low or data are noisy, the asymmetry parameter in a 5PL can become unconstrained and produce extrapolated concentrations outside the standard range that look reasonable on residual plots but are not reliable. Higher-density standards near the LLOQ and stability checks across independent runs help guard against this, per Bio-Rad’s curve-fitting guidance.
Does model choice actually change assay results in practice?
It can meaningfully change results, particularly at the low end of the curve. A peer-reviewed study of mixture toxicity curves found that switching to an asymmetric fit changed interpretation in a notable portion of curves tested.
What should a validation report document about the curve-fit model?
It should record the calibrator design, weighting scheme, model comparison statistics such as SS-Res or AIC, back-calculated QC performance across independent runs, and the specific software and version used for fitting. The FDA bioanalytical method validation guidance recommends using the simplest model that adequately fits the data and documenting any deviation.
Sources
- Principles of curve fitting (Bio‑Rad technical note)
- Evaluation of an asymmetry parameter for curve-fitting in single-chemical and mixture toxicity assessment
- M10 Bioanalytical Method Validation and Study Sample Analysis (FDA)