Preserve CQAs During Cell Culture Scale Up for Process Developers
Scale-up succeeds when you choose a reactor path that preserves critical quality attributes and back it with a qualified scale-down model, matching kLa and P/V while keeping CO2 in range, rather than simply multiplying volume. The main levers are bioreactor format, operational mode, and timing of regulatory comparability. Before committing capital, run a risk assessment and build a scale-down model that can catch problems before they reach your pivotal batches.
TL;DR:
- A qualified scale-down model should match key parameters like kLa, P/V, and tip speed to ensure process similarity during scale-up.
- Selecting the appropriate bioreactor format depends on cell type, with suspension cells suited for stirred tanks and adherent cells requiring surfaces like microcarriers or fixed beds.
- Managing oxygen transfer and CO2 removal at scale necessitates adjusting sparge design and gas flow, as bubble path length and headspace ratios influence gas exchange efficiency.
- Validating larger-scale systems involves specific qualification procedures for equipment and process performance, with emphasis on independent replicate runs to demonstrate consistency.
- Downstream process capability and batch release criteria require updating at scale, especially for potency assays and sampling schemes, to accurately reflect process variability and ensure product quality.
Table of Contents
- Scale-Up Strategies and Choice of Bioreactor Formats
- Engineering Criteria: Mixing, Oxygen Transfer, CO2 Removal, and Shear
- Seed Train and Inoculum Strategies
- Operational Modes: Fed-Batch, Perfusion, and Continuous Approaches
- Scale-Down Models and Risk Mitigation
- Regulatory Planning and Comparability
- Downstream Integration and Harvesting for Shear-Sensitive Cells
- Project Checklist and Resources for Process Developers
- Mass Transfer and Oxygenation Challenges Specific to Scale-Up
- Heat Transfer and Temperature Control During Scale-Up
- Cell Metabolism Changes and Nutrient Demand Shifts at Larger Scales
- Validation and Qualification Protocols for Scaled-Up Systems
- Quality Assurance and Batch Release Criteria Adjustments
- Economic Considerations and Cost Impact Analysis During Scale-Up
- A Practitioner’s View on Where Scale-Up Is Heading
- How We Support Your Scale-Up Work
- FAQ
- Sources
Scale-Up Strategies and Choice of Bioreactor Formats
The format decision starts with the cell type. Suspension-adapted cells scale cleanly in stirred-tank reactors (STRs), while adherent cells need a surface: microcarriers in an STR, fixed-bed systems, or hollow-fiber cartridges. Each path carries different consequences for seed-train length, turndown ratio, and media logistics.
Scale-up (bigger vessels) and scale-out (more identical vessels) solve different problems. Scale-up reduces footprint and operator burden per liter of output but concentrates risk in fewer, larger batches. Scale-out keeps unit operations small and familiar, useful for autologous cell therapies where each patient’s batch is independent, but multiplies the inoculum and QC burden.
Fixed-bed and hollow-fiber systems deserve a look when your cells are highly shear-sensitive or require tight adhesion cues that microcarrier beads cannot replicate well. They tend to suit lower-throughput, higher-value processes such as autologous cell therapy manufacturing rather than high-volume biologics production.
- Suspension/STR: best for high-density, high-throughput processes like monoclonal antibody production.
- Microcarrier/STR: bridges adherent cell biology with stirred-tank economics, but adds bead-to-bead transfer complexity.
- Fixed-bed: favors shear-sensitive, adhesion-dependent cells with lower automation overhead.
- Hollow-fiber: supports very high local cell density in a compact, often single-use footprint.
Whichever format you pick, the choice ripples into seed-train design, turndown ratio limits, and the volume of media you need to stage, feed, and dispose of at each batch. Media logistics alone can shift cost of goods sold (COGS) enough to change which format wins on paper versus in the plant.
Engineering Criteria: Mixing, Oxygen Transfer, CO2 Removal, and Shear
Four parameters govern whether a larger vessel behaves like its small-scale predecessor: volumetric mass transfer coefficient (kLa), power per unit volume (P/V), gas flow rate per volume per minute (vvm), and impeller tip speed. kLa describes how efficiently oxygen moves from gas to liquid; P/V describes the energy input driving mixing and, indirectly, shear; vvm sets sparge gas flow relative to working volume; tip speed is a simple proxy for the mechanical stress cells experience near the impeller.
Agitation is commonly scaled using P/V, with aeration adjusted through vvm, and these two parameters are the starting point for most scale-up calculations in mammalian cell culture, according to a review of monoclonal antibody production processes. Matching P/V and kLa between scales keeps dissolved oxygen delivery and mixing time in a similar range, but it does not guarantee an identical shear environment, since geometry and impeller type change how energy translates into local stress.
Hydrodynamic shear correlates with titer declines in CHO cultures, and average shear stress has been proposed as a practical criterion for comparing dissimilar reactor configurations during scale-up and scale-down work, per a study on hydrodynamic stress in mammalian cell culture. Shear sensitivity varies by cell line, so this metric is a starting point, not a universal threshold.
CO2 stripping gets harder as vessels grow, because the path length gas bubbles travel before reaching the surface increases while the ratio of sparger surface area to volume typically shrinks. Practical mitigations include cascade aeration strategies and, in some cases, supplementing oxygen delivery rather than simply raising agitation, since increasing gas flow at the sparger is often a more efficient first response to oxygen and CO2 issues than increasing power input, which risks added shear, as noted in engineering guidance on gas management.
- Define target kLa and P/V ranges from small-scale process data before specifying large-scale equipment.
- Select vvm and sparger design to manage oxygen delivery and CO2 stripping together, not in isolation.
- Use average shear stress or tip speed as a secondary check once P/V and kLa are matched.
- Instrument dissolved oxygen (DO), off-gas composition, pCO2, osmolality, and key metabolite trends at every scale.
Pro Tip: Trend off-gas CO2 and O2 uptake rates in real time; a drifting oxygen uptake rate often signals a metabolic shift before viable cell density or titer assays would catch it.
Seed Train and Inoculum Strategies
A conventional seed train expands a thawed vial through a series of increasing vessel sizes, often three to five steps, until the inoculum reaches the volume and density needed to seed the production bioreactor. Each step has a turndown ratio ceiling, typically a 1:5 to 1:10 expansion, which in turn sets how many steps you need and how long the seed train takes before production even starts.
Direct-thaw or no-seed-train approaches skip some of these intermediate steps by inoculating the production vessel directly from a cryopreserved bank or through bead-to-bead transfer. Recent work on adipose-derived mesenchymal stromal cell (MSC) manufacturing demonstrates integrated workflows, including direct inoculation after thaw and bead-to-bead transfer, that support scalable production without a full seed train in some configurations, while maintaining closed downstream processing with high viability, according to a review of integrated bioreactor workflows for MSC scale-up. These shortened workflows can reduce contamination risk and compress timelines, which matters most for autologous or near-patient cell therapy manufacturing where speed affects patient outcomes.
- Define acceptance criteria for each seed stage: viability threshold, doubling time, and density at passage.
- Confirm sterility and mycoplasma testing cadence matches your risk tolerance for each expansion step.
- Track population doubling level across the seed train to flag drift before it reaches the production vessel.
- Where a direct-thaw strategy is used, qualify the thaw and recovery kinetics specifically, since they replace steps a traditional seed train would have screened.
Operational Modes: Fed-Batch, Perfusion, and Continuous Approaches
Fed-batch remains the default for many monoclonal antibody and recombinant protein processes because it is well understood, requires simpler downstream capture, and fits standard single-use STR platforms. Perfusion and continuous modes earn their complexity when you need higher cell densities, a smaller footprint, or a product that is unstable in the bioreactor and benefits from continuous removal.
The decision rests on product dose requirements, target cell densities, available footprint, media consumption budget, and whether your downstream train can keep pace with continuous output. A process that demands very high density in a small vessel, as many cell therapy and dose-intensive biologics processes do, tends to favor perfusion.
Perfusion performance depends heavily on two tunable parameters: when perfusion starts relative to inoculation, and the perfusion rate, often expressed as vessel volumes per day (VVD). A design-of-experiments study in Ambr 250 perfusion bioreactors found that earlier perfusion starts and higher perfusion rates reliably increased CAR-T cell expansion yields without compromising critical quality attributes, according to research on perfusion optimization for CAR-T expansion. Operationalizing that gain at scale requires downstream capture technology capable of handling continuous flow, since upstream intensification without matching downstream capacity simply shifts the bottleneck.
- Choose fed-batch when downstream capture is batch-oriented and product stability in-process is not limiting.
- Choose perfusion when target density or product lability demands continuous harvest, and confirm downstream can run continuously too.
- Budget media volume and water-for-injection (WFI) supply early, since perfusion and continuous modes consume far more liquid media per batch than fed-batch.
Scale-Down Models and Risk Mitigation
A qualified scale-down model (SDM) reproduces the mixing, mass transfer, and shear environment of the full-scale process at bench scale, so you can run the experiments you cannot afford to run at the production scale. Qualification requires statistically independent replicate runs, not just repeated samples from a single run, to produce evidence that regulators and your own quality group can trust.
Detailed equipment characterization, computational fluid dynamics (CFD), and scale-down models are described as critical to demonstrating similarity of mixing, mass transfer, and shear across scales up to 25,000 liters, feeding directly into quality-by-design (QbD) design spaces, according to a review of equipment characterization for cell culture technology transfer. Building an equipment database that captures impeller geometry and mixing behavior at each scale accelerates both the transfer and any troubleshooting that follows.
- Select scale criteria (P/V, kLa, shear) based on CFD and equipment characterization, not assumption.
- Build the SDM at bench or pilot scale and qualify it with independent runs spanning multiple days and operators.
- Use the SDM to probe failure modes: localized shear near impellers, CO2 accumulation in larger headspace-to-volume ratios, and feeding-related osmolality spikes.
- Feed SDM data into your design-of-experiments (DOE) plan to define a design space that covers normal operating range and worst-case excursions.
Regulatory Planning and Comparability
Sponsors developing cell and gene therapies should plan manufacturing changes, including scale-up, around clinical milestones rather than after them. FDA guidance on manufacturing changes and comparability for human cellular and gene therapy products recommends implementing major manufacturing changes before pivotal studies whenever possible, because comparability work becomes substantially more complex once pivotal data is locked to a specific process version.
Comparability studies must assess the change’s effect on product quality attributes, including potency, not just identity and purity. This single requirement shapes much of a scale-up project’s documentation burden, since potency assays are often the slowest and most variable piece of a release package.
When full-scale lots are not yet available to anchor a comparability study, the same guidance supports data-driven risk assessments backed by qualified scale-down model data as interim evidence.
- Select and validate a potency assay early, since it anchors every later comparability argument.
- Define sampling points across the seed train and production run that let you reconstruct a process history if a deviation occurs.
- Assemble documentation packages (batch records, SDM qualification reports, CFD summaries) in parallel with execution, not after.
- Build timelines backward from your pivotal study start date, not forward from your current scale.
Downstream Integration and Harvesting for Shear-Sensitive Cells
Upstream scale decisions only pay off if downstream can actually process the harvest without damaging the cells or losing yield. For shear-sensitive therapeutic cells, counterflow centrifugation and low-shear tangential flow filtration (TFF) are common harvest choices, each with yield and viability trade-offs that depend on cell size and membrane fragility.
Buffer exchange and concentration steps determine how much volume your production reactor can realistically hand off at harvest, which in turn constrains batch size planning upstream. A reactor sized without checking downstream hold and concentration capacity can produce more material than the downstream train can safely process in the required window.
- Match harvest method (counterflow centrifugation, low-shear TFF, depth filtration) to cell fragility and target recovery.
- Size buffer exchange and concentration steps against actual harvest volume, not nominal reactor capacity.
- Favor closed, integrated automation between bioreactor and harvest skid to cut manual transfer steps and contamination exposure.
Project Checklist and Resources for Process Developers
A practical scale-up project moves through risk assessment, scale-down model planning, a defined monitoring list, a DOE plan, comparability evidence, and finalized sampling and potency assay strategy, in that order.
- Run a formal risk assessment on your current process before selecting scale criteria.
- Design and qualify an SDM using independent replicate runs across operators and days.
- Finalize your monitoring list (DO, pCO2, osmolality, metabolites, off-gas) before scale-up execution begins.
- Build a DOE plan around the design space your SDM data supports.
- Assemble comparability evidence and lock your potency assay and sampling plan.
For sourcing reagents, cell-counting tools, and assay supplies that support this workflow, our bioprocessing tools resources and cell culture technique guidance cover instrumentation and QC practices in more depth. Reach out through our product pages for technical questions or volume supply needs.
Mass Transfer and Oxygenation Challenges Specific to Scale-Up
Oxygen demand per liter does not change much as you scale up, but the physics of delivering that oxygen does. Larger vessels have a lower surface-area-to-volume ratio, so headspace aeration contributes less and sparged gas has to do more work, while the bubble path length to the surface grows, changing residence time and transfer efficiency.
The practical result is an oxygen gradient: cells near the sparger see higher dissolved oxygen and more bubble-associated shear, while cells farther away can see lower oxygen availability, especially at high cell densities late in a run. This gradient is invisible to a single DO probe reading an average value, which is why mixing time and circulation rate matter as much as the bulk DO setpoint.
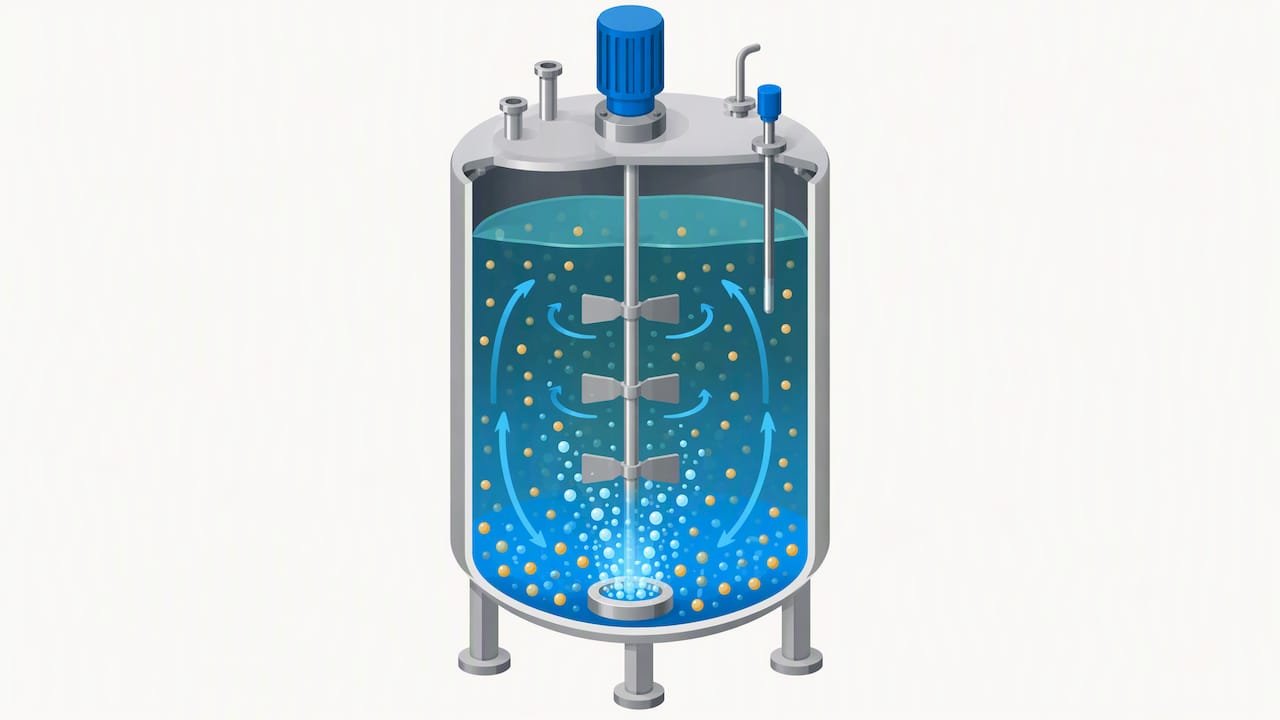
Engineering guidance suggests that increasing sparge gas flow is often a more efficient way to resolve oxygen transfer limitations than increasing agitation power, because raising power input to boost kLa also raises local shear, a trade-off that matters more as vessels and impellers scale up, per guidance on gas management versus agitation for oxygen transfer. Microsparger designs can improve transfer efficiency but add foaming risk, which needs its own mitigation (antifoam strategy, headspace design) when you move to production scale.
Practically, this means oxygen transfer strategy cannot be finalized from small-scale data alone. It needs validation at intermediate pilot scale, ideally using the same scale-down model built for mixing and shear characterization, so gradients are measured rather than assumed away.
Heat Transfer and Temperature Control During Scale-Up
Temperature control gets harder at scale for a reason that is easy to overlook: heat generation from cell metabolism and agitation scales with volume, but the cooling jacket’s surface area for heat removal scales more slowly. A 10,000-liter vessel has far less jacket surface per liter of broth than a 10-liter bench reactor, which means the same temperature control strategy that worked at bench scale can struggle to keep pace at production scale, particularly during high-density late-stage culture when metabolic heat output peaks.
This surface-to-volume mismatch is one of the clearest physical constraints that defeats simple linear scale-up thinking. It is also why temperature excursions, rather than being rare, tend to cluster at specific points in a scale-up project: right after inoculation when agitation and feed additions are adjusted, and late in the run when viable cell density and metabolic heat are highest.
Jacket design, internal cooling coils, and external heat exchanger loops are the common engineering responses, each with different response times and control precision. A control strategy tuned for a bench reactor’s fast thermal response usually needs retuning, since larger vessels respond more sluggishly and overshoot more easily if the control loop is not adjusted for the new thermal mass.
Building temperature control validation into your scale-down model work, rather than treating it as a separate equipment qualification exercise, catches these mismatches before they show up as an unplanned deviation in a GMP batch.
Cell Metabolism Changes and Nutrient Demand Shifts at Larger Scales
Cells do not necessarily consume glucose, glutamine, or oxygen at a different rate per cell simply because the vessel got bigger, but the microenvironment they experience can shift their metabolic behavior. Gradients in dissolved oxygen, CO2, and local nutrient concentration, more pronounced in larger, less homogeneously mixed vessels, can push cells toward different metabolic states than what a well-mixed bench reactor would show.
A common pattern is an increase in lactate production relative to glucose consumption when cells experience transient oxygen limitation or mixing heterogeneity, a shift that was not visible at small scale where mixing was fast and gradients were minimal. This is one reason off-gas and metabolite trend monitoring, rather than single-point sampling, matters more as scale increases.
Nutrient feed strategies calibrated at bench scale often need adjustment at production scale, not because the biology changed, but because feed addition points create transient local concentration spikes that behave differently in a larger, slower-mixing vessel. A bolus feed that dispersed in seconds at bench scale might take much longer to homogenize at production scale, creating a brief but real osmolality or nutrient spike near the addition point.
Tracking metabolite trends (lactate, ammonia, glucose, glutamine) alongside osmolality across the production run, and comparing the trend shape rather than just endpoint values against bench-scale history, is the most reliable way to catch a metabolic shift before it affects titer or product quality.
Validation and Qualification Protocols for Scaled-Up Systems
Validation at a new scale is not a repeat of bench-scale validation with bigger numbers. It requires its own qualification package: installation qualification and operational qualification for the new equipment, followed by performance qualification runs that demonstrate the process performs as intended at the new scale, typically across multiple consecutive runs to establish consistency.
Equipment characterization, including impeller geometry, sparger design, and mixing time studies specific to the new vessel, should be documented before performance qualification begins, since these are the physical parameters your scale-down model was built to predict. A review of equipment characterization practices for technology transfer describes building an equipment database across scales as a practice that both supports qualification and accelerates troubleshooting later.
Qualification and validation are related but distinct: qualification confirms equipment and systems perform as specified, while validation confirms the process consistently produces output meeting predefined quality criteria, a distinction worth keeping straight in your documentation strategy, as outlined in a practical guide to qualification versus validation for pharmaceutical quality assurance.
For cell and gene therapy processes specifically, qualification runs should use separate thawed cell bank vials for each replicate and span multiple days and operators, capturing the operational variance a single continuous run would miss entirely.
Quality Assurance and Batch Release Criteria Adjustments
Batch release criteria established at bench or pilot scale do not automatically transfer to production scale without review. Assay ranges set against small-scale process variability can be too tight or, in some cases, inappropriately loose once production-scale variability is characterized, so release specifications typically need a formal review tied to your comparability data package.
Potency assay results carry particular weight here, since FDA guidance on comparability for cellular and gene therapy products specifically calls out potency as a quality attribute that comparability studies must assess when a manufacturing change, including scale-up, is introduced. A release specification that does not account for scale-related assay variability risks either false batch rejections or, worse, passing material that would not have passed at the original scale.
Sampling plans also need revisiting: a sampling scheme designed for a 10-liter bench run rarely scales proportionally to a 2,000-liter production run, since the number and placement of samples needed to represent a larger, potentially less homogeneous vessel is a separate statistical question from simply sampling more often.
Building quality assurance review into the scale-up project plan from the start, rather than as a gate at the end, avoids the common failure mode where a process is technically running well at the new scale but its release package is not yet defensible.
Economic Considerations and Cost Impact Analysis During Scale-Up
Scale-up decisions are engineering decisions with direct cost consequences, and the trade-offs rarely point in one obvious direction. A single large stirred-tank reactor typically lowers cost of goods sold per gram of product through labor and facility efficiency, but it concentrates batch failure risk: losing one 2,000-liter batch costs far more than losing one of several smaller parallel batches.
Perfusion and continuous processes often carry lower reactor capital cost per unit of output because they intensify density in a smaller footprint, but they shift cost toward media consumption and downstream capture capacity, since continuous harvest demands continuous downstream throughput. Media alone can become the dominant line item in a perfusion process budget, particularly for chemically defined formulations at production volumes.
Seed-train length and format also carry a cost signature that is easy to underestimate: every additional seed-train step adds labor, consumables, and QC testing time before the production run even starts. Direct-thaw or shortened seed-train workflows, where validated, reduce that overhead, which is part of why the approach draws interest for time-sensitive cell therapy manufacturing in addition to its contamination-risk benefits.
The least obvious cost driver is often comparability work itself: a scale-up that triggers extensive comparability testing, additional potency assay validation, and documentation review can erase much of the COGS advantage a bigger reactor was expected to deliver, particularly if that work happens late and delays a pivotal study timeline.
A Practitioner’s View on Where Scale-Up Is Heading
Automation and perfusion adoption are converging faster than most process development teams have fully planned for, and model-driven approaches, from CFD to early machine learning predictions of scaling parameters, are starting to shrink the gap between bench data and production confidence. None of that replaces a properly qualified scale-down model.
Pro Tip: Fund your comparability and SDM qualification work as if it were on the critical path, because it is. The projects that stall are rarely the ones with a shear problem; they are the ones that discovered the shear problem after the comparability package was already due.
— Alina
How We Support Your Scale-Up Work
Scaling a cell culture process means fewer surprises when your reagents, assays, and cell-counting tools are consistent from bench to pilot to production, and we built our catalog around exactly that continuity. Our bioassays and testing services support potency and functional characterization work, our cell biology products cover specialized cell lines and karyotype analysis for comparability studies, and our viral transduction and bioprocessing tools support upstream intensification work directly.

If you need volume pricing or want to talk through a specific scale-up question with our technical team, visit our product catalog or reach out through any product page’s contact form, and we will work through sourcing and technical details with you directly.
This article is general information, not a substitute for advice from a qualified doctor. Consult a qualified healthcare professional about your own circumstances before acting on anything here.
FAQ
What are the four stages of cell culture?
The four stages are typically described as initiation (establishing a culture from a primary source or cell bank), growth or exponential phase, stationary phase where growth plateaus, and decline or senescence as nutrients deplete or waste accumulates. In an industrial seed-train context, these stages repeat at each expansion step before cells reach the production bioreactor.
How can bioreactors be scaled up?
Bioreactors are scaled up by matching key engineering parameters, particularly P/V and kLa, between the small and large vessel rather than simply multiplying working volume, since geometry and mixing behavior do not scale linearly, according to a review of cell culture scale-up practices. A qualified scale-down model and equipment characterization, including CFD, help confirm the match before committing to full-scale runs.
Why 5% CO2 for cell culture?
A 5% CO2 atmosphere is commonly used because it maintains the bicarbonate buffering system in standard mammalian cell culture media at a pH suitable for most cell lines, typically around pH 7.2 to 7.4. The exact percentage needed depends on the specific media formulation and its bicarbonate concentration, so some protocols use different CO2 levels to match their buffer system.
Who is the father of cell culture?
Ross Granville Harrison is widely credited with pioneering modern tissue culture techniques, demonstrating that animal tissue could survive and grow outside the body. His work laid the foundation for the cell culture methods used in research and manufacturing today.
What is a scale-down model used for in process development?
A scale-down model is a bench or pilot-scale system built to reproduce the mixing, oxygen transfer, and shear conditions of a full production-scale bioreactor, so process developers can run risk experiments that would be impractical at full scale. Qualified scale-down models, built with independent replicate runs, generate evidence used in regulatory comparability packages when a manufacturing change like scale-up occurs.
Sources
- Manufacturing changes and comparability for human cellular and gene therapy products — FDA
- Cell culture processes for monoclonal antibody production — PMC