Exosome Flow Cytometry: Methods, Controls and Limits
Flow cytometry can count, size and phenotype exosomes, but only if you treat them as what they are: particles far smaller than the cells the instrument was built for. A standard cell cytometer will often see exosome signal as noise. Reliable results come from the right instrument, bead-based or carefully controlled labeling, calibrated settings and full reporting. This guide walks through each step, from how the method works to the controls reviewers expect.
TL;DR
- Flow cytometry measures light scatter and fluorescence from single particles, so it can report concentration, size and surface markers for extracellular vesicles (EVs) in one run.
- Conventional cell cytometers struggle with small EVs because signals overlap with background and with swarm detection, where several particles are counted as one event.
- Use buffer-only blanks, detergent-lysed samples or isotype controls, calibration beads and the lowest practical flow rate.
- On-bead capture with tetraspanin antibodies is a practical route when your instrument cannot resolve single small EVs.
- Report your settings in a standard format such as MIFlowCyt-EV so other labs can compare your data.
Table of Contents
- What flow cytometry measures when the target is an exosome
- Why exosomes are hard to see on a conventional cytometer
- Conventional versus nanoscale flow cytometry
- Preparing and labeling samples
- Controls that make the data believable
- Calibration and standardization
- What the data can and cannot tell you
- A practical workflow, step by step
- Our perspective
- Where our products fit
- Common mistakes to avoid
- FAQ
- Sources
What flow cytometry measures when the target is an exosome
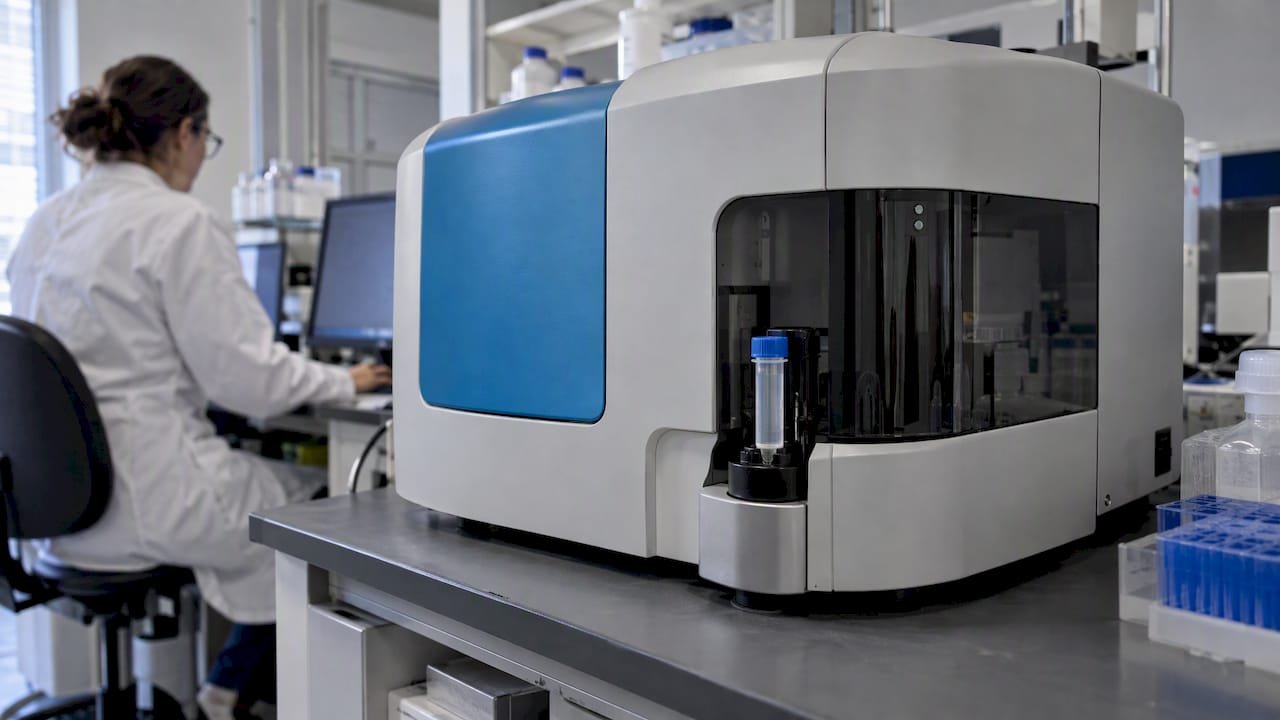
A flow cytometer sends particles one by one through focused laser beams and records the light they scatter and the fluorescence they emit. For EVs, fluorescence can identify EV-associated biomolecules, while scatter can be used to derive diameter and refractive index. The same run can also give an EV number concentration.
That combination is the appeal. Compared with bulk methods such as western blotting, which average over millions of vesicles, cytometry looks at particles individually. A 2016 review describes the strengths as high throughput, single-particle resolution and multi-marker capability. Its historical weakness was a detection limit that excluded the smallest exosomes.
If you are choosing between a bulk and a single-particle readout, our guide to exosome western markers covers the bulk side, and it pairs well with cytometry data.
Exosomes, microvesicles and apoptotic bodies
People often ask about the three types of extracellular vesicles. They are usually described as exosomes, microvesicles and apoptotic bodies. Exosomes are roughly 30 to 150 nm and come from multivesicular bodies, microvesicles are about 100 nm to 1 µm and bud from the plasma membrane, and apoptotic bodies are about 500 nm to 2 µm and come from dying cells.

Those size ranges overlap, which matters for cytometry. Size cannot prove origin, so most papers now say “small EVs” unless they have shown biogenesis. When this article says exosomes, it follows the common lab usage for small EVs positive for markers such as CD9, CD63 and CD81.
Why exosomes are hard to see on a conventional cytometer
Three physical problems explain most failed experiments.
- Size and noise. Most flow cytometers are designed for larger cells, so EV signals can overlap with background noise.
- Little surface to label. EVs have limited surface area, which restricts the number of markers that can be detected on a single particle.
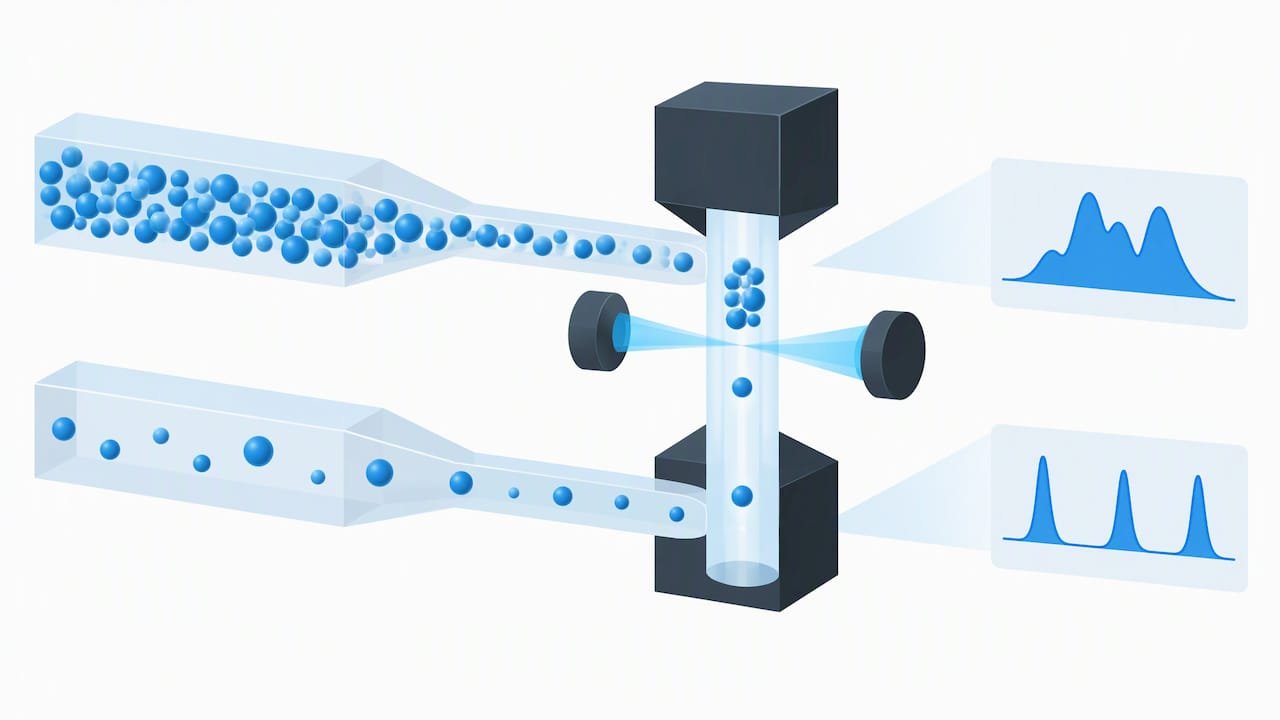
- Swarm detection. Swarm detection is a form of coincidence detection in which multiple particles are in the laser beam together and are wrongly measured as a single count.
The sensitivity limit is real. A 2020 study reported that immunophenotyping small EVs of about 70 nm on a conventional cytometer was essentially impossible, because of their size and the scarcity of antibody binding sites. The same paper argued that routine use of conventional instruments remains questionable, since the highly diluted samples need long measurement times.
The size distribution can also mislead. A 2017 review in the Journal of Extracellular Vesicles notes that insensitivity at the small end may skew results toward larger particles. If your histogram looks like it is missing the bottom of the distribution, it probably is.
Conventional versus nanoscale flow cytometry
The instrument decides what questions you can answer. Nanoscale cytometers are optimized for particles smaller than 100 nm, with fluidics and optics suited to sensitive detection of small EVs, while conventional instruments are optimized for cells. The trade-off in the same source: nanoscale instruments typically offer higher sensitivity but may have lower throughput.
| Factor | Conventional cell cytometer | Nanoscale or dedicated EV cytometer |
|---|---|---|
| Designed for | Cells, usually above 300 nm for scatter | Particles below 100 nm |
| Single small EV detection | Limited, often near or below the noise floor | Built for it |
| Throughput | Higher | Typically lower |
| Typical strategy | Bead capture, larger EVs, bulk phenotype | Direct single-vesicle counting and phenotyping |
| Access | Common in core facilities | Less common |
The 2016 review in Analyst adds context: flow cytometers have historically struggled with particles under 300 nm, while newer machines are pushing detection limits to 100 nm and beyond. In practice, check your core facility’s actual detection limit with calibrated beads before you plan the experiment around it.
Preparing and labeling samples
Your sample is the first place data quality is won or lost. Isolation method, residual protein and aggregates all show up in the cytometer.
Start with a clean isolate
How you isolate affects what you can label. Ultracentrifugation, size-exclusion chromatography, precipitation and affinity capture carry different co-isolates. We compare them against downstream assays in matching exosome isolation methods to your assay, and our exosome isolation range covers the kit options.
If you culture cells for your EVs, serum is a hidden source of particles. See exosome-depleted FBS: methods, trade-offs and controls before blaming your cells for a high background.
Labeling and cleanup
Researchers working on improved detection pre-filtered antibodies to remove aggregates, used detergent-lysed samples to set gates, and added post-staining filters to cut background. They also noted that filtration can lose small EVs, so test recovery rather than assuming it.
Two more practical points:
- Dye aggregation creates fake events. A 2020 review suggests judicious fluorescent labeling to avoid artifacts caused by dye aggregation.
- Titrate your antibody. Excess antibody and free dye both generate particles that look like EVs. Run the same staining mix with buffer only to see how many.
Direct labeling or bead capture?
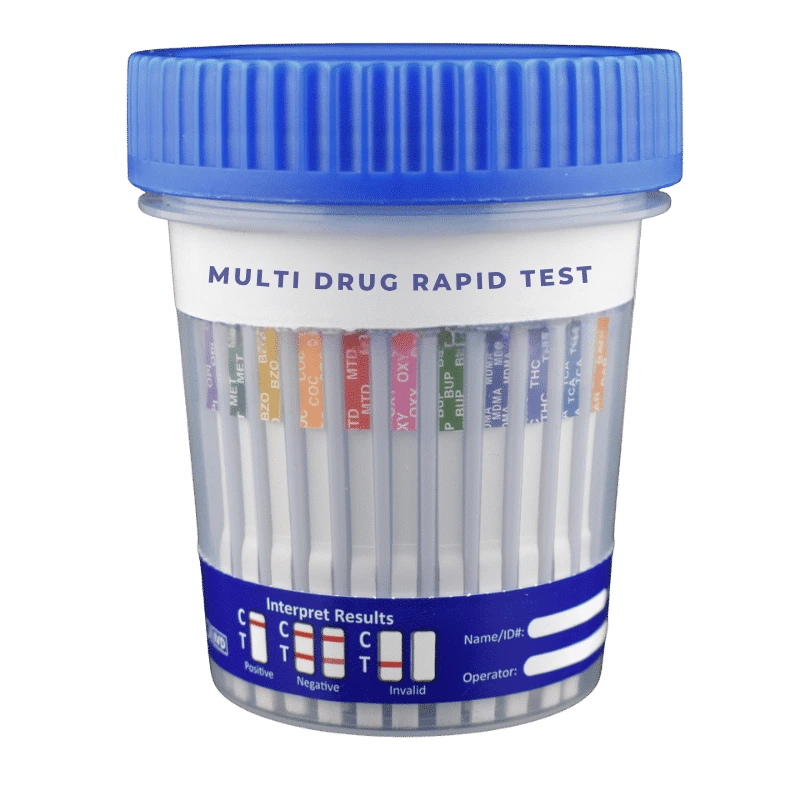
When the cytometer cannot resolve single small EVs, bead-based capture is the common workaround. In on-bead flow cytometry, exosomes are captured by antibodies against tetraspanins on streptavidin-labeled beads and then phenotyped. The beads are large enough for any cytometer, but you read the population average on each bead, not individual vesicles.
| Approach | You get | You give up |
|---|---|---|
| Direct single-EV labeling | Particle counts, size, per-vesicle markers | Needs a sensitive instrument and strict calibration |
| On-bead capture | Works on conventional cytometers, good for marker profiling | No single-vesicle data, capture bias toward the chosen antibody |
Controls that make the data believable
Without controls, a plot of dots is not evidence of exosomes. The research points to a short, non-negotiable list.
- Buffer-only sample to measure background noise from the buffer, dye and antibody.
- Unstained sample to set the autofluorescence baseline.
- Isotype control where appropriate. For on-bead work, isotype antibody controls are described as obligatory when quantifying exosome surface proteins.
- Detergent-lysed sample. Lysed samples are a useful alternative to isotype controls for setting gates that exclude background fluorescence. If the signal survives lysis, it was not a membrane vesicle.
- Serial dilution. If event counts do not fall in proportion to dilution, you are probably in swarm detection.
Avoiding swarm detection
Swarm detection can be prevented by diluting the sample before analysis or lowering the sample flow rate. The 2023 compendium also recommends the lowest possible flow rates for this reason. A dilution series is the cheapest test: plot concentration against measured events and keep only the linear range.
Calibration and standardization
Calibration is what turns a plot into a measurement. In conventional cytometry, light scattering intensity is expressed in arbitrary units, which complicates comparison between instruments and laboratories.
Two calibration tools show up repeatedly:
- Fluorescence calibration beads. Standardized beads, such as MESF beads, let you convert fluorescence to standard units. Theodoraki and colleagues used MESF beads to turn mean fluorescence intensity into molecules of equivalent soluble fluorochrome.
- Scatter reference particles. Scatter depends on size and refractive index, so a 2017 review notes that side-scatter analysis needs a standard with a similar refractive index. Polystyrene beads scatter more than EVs of the same size, so a bead-based diameter can understate how large an EV really is.
Reporting so others can reproduce you
The International Society for Extracellular Vesicles, the International Society for Advancement of Cytometry and the International Society on Thrombosis and Haemostasis published the MIFlowCyt-EV framework to standardize how EV flow cytometry experiments are reported. Fill it in as you work, not after the paper is written.
Good reporting is less about the template than the habit of defining what you measured. Our piece on data reporting for molecular biology covers that discipline, and the same thinking applies when you define measurable cellular endpoints in a disease model so that results can be compared between labs.
What the data can and cannot tell you
Used well, cytometry can report EV concentration, a fluorescence-based picture of associated biomolecules, and scatter-derived diameter and refractive index. Used carelessly, it produces confident, wrong numbers.
Keep these limits in mind when you write up results:
- Dynamic range limits the visible size range. What you count is a window, not the whole population.
- Small EVs may be missing. The skew toward larger particles can make a sample look bigger than it is.
- Background can masquerade as signal unless the blank and lysis controls are shown.
- Single-particle counts are not absolute truth. Report concentration as “within the detection range of this instrument and settings”.
In practice, many labs pair cytometry with an orthogonal method. Nanoparticle tracking analysis gives a size distribution for the whole sample, and western blotting confirms marker presence. Cytometry then answers the question neither can: which proportion of particles carries which marker.
A practical workflow, step by step
- Define the question. Concentration, size, marker profile or subpopulation? That decides the instrument and the strategy.
- Check the instrument’s detection limit with calibrated beads at your planned settings.
- Isolate and characterize the sample. Confirm EVs by an independent method before cytometry.
- Filter antibodies, titrate and stain. Run buffer-plus-antibody blanks.
- Run dilution series at the lowest practical flow rate to find the linear range.
- Acquire controls first: buffer, unstained, isotype or lysed.
- Calibrate fluorescence (and scatter if you report size) with reference beads.
- Analyze with gates set from controls, not from the sample itself.
- Report with MIFlowCyt-EV, listing instrument, settings, controls and calibration.
Our perspective
Most of the cytometry problems we see discussed by researchers are sample problems that arrive at the cytometer, not instrument problems. A dirty isolate, an unfiltered antibody or an unreported dilution will cost more than a less sensitive machine. We support labs on the upstream side, with exosome isolation and detection products, and nanoparticle tracking analysis among our services, so a cytometry run is not the only evidence you have.
Our advice is to treat flow cytometry as one lens. If your instrument is a conventional one, choose bead capture and say so plainly. If you have access to a nanoscale instrument, still run the lysis control. And write down your settings the day you run them.
— Alina
Where our products fit
If you are building this workflow, start with the exosome detection products for marker-based readouts, and the purified exosomes range when you need a reference material for setting up gates and controls. You can browse the full exosome product line, or contact us through mayflowerbio.com to discuss supply for your lab.
Common mistakes to avoid
- Gating on the sample. Gates drawn on the signal you hope to see are confirmation bias. Set them on blanks and lysed controls.
- Running too concentrated. More events per second is not more data when particles coincide.
- Skipping the antibody-only control. Free dye and aggregates produce particle-like events.
- Reporting arbitrary units across instruments. Convert with calibration beads or say clearly that comparison is not valid.
- Calling everything an exosome. Without evidence of origin, call them small EVs.
FAQ
Can a standard flow cytometer detect exosomes?
Sometimes, but with limits. Most cell cytometers were designed for larger particles, so small EV signal can sit in the noise, and a 2020 study reported that immunophenotyping about 70 nm EVs was essentially impossible on a conventional instrument. Bead capture or a nanoscale instrument is the usual solution.
What is the working principle of flow cytometry?
Particles pass one at a time through focused laser beams while detectors record scattered light and fluorescence. Scatter relates to size and refractive index, and fluorescence reports labeled molecules. For EVs, the same principle applies, but the signal is much weaker.
What controls are essential for exosome flow cytometry?
At minimum, run a buffer-only blank, an unstained sample and either an isotype control or a detergent-lysed sample. A dilution series helps confirm you are not seeing swarm detection. Report all of them.
What are the three types of extracellular vesicles?
Exosomes, microvesicles and apoptotic bodies, distinguished by how they form and, roughly, by size. Because the sizes overlap, size alone does not prove which type you have.
Sources
- A compendium of single extracellular vesicle flow cytometry
- Measuring Extracellular Vesicles by Conventional Flow Cytometry
- Techniques to improve detection and analysis of extracellular vesicles
- Evaluation of Exosome Proteins by on-Bead Flow Cytometry
- Phenotypic analysis of extracellular vesicles: a review
- Reliable measurements of extracellular vesicles by clinical flow cytometry
- Quantification of Exosomes
- Detection and isolation of circulating exosomes
- Types of extracellular vesicles: exosomes, microvesicles, and apoptotic bodies